Exhibit 99.3
Adaptimmune Engineered TCR T cell therapy Jefferies Autumn Global Healthcare Conference 18th November 2015
Exhibit 99.3
Adaptimmune Engineered TCR T cell therapy Jefferies Autumn Global Healthcare Conference 18th November 2015
Disclaimer This presentation contains “forward-looking statements,” as that term is defined under the Private Securities Litigation Reform Act of 1995 (PSLRA), which statements may be identified by words such as “believe,” “may”, “will,” “estimate,” “continue,” “anticipate,” “intend,” “expect” and other words of similar meaning. These forward-looking statements involve certain risks and uncertainties. Such risks and uncertainties could cause our actual results to differ materially from those indicated by such forward-looking statements, and include, without limitation: the success, cost and timing of our product development activities and clinical trials; our ability to submit an IND and successfully advance our technology platform to improve the safety and effectiveness of our existing TCR therapeutic candidates; the rate and degree of market acceptance of T-cell therapy generally and of our TCR therapeutic candidates; government regulation and approval, including, but not limited to, the expected regulatory approval timelines for TCR therapeutic candidates; and our ability to protect our proprietary technology and enforce our intellectual property rights; amongst others. For a further description of the risks and uncertainties that could cause our actual results to differ materially from those expressed in these forward-looking statements, as well as risks relating to our business in general, we refer you to our Annual Report on Form 20-F filed with the Securities and Exchange Commission (SEC) on October 13, 2015 and our other SEC filings. We urge you to consider these factors carefully in evaluating the forward-looking statements herein and are cautioned not to place undue reliance on such forward-looking statements, which are qualified in their entirety by this cautionary statement. The forward-looking statements contained in this presentation speak only as of the date the statements were made and we do not undertake any obligation to update such forward-looking statements to reflect subsequent events or circumstances. We intend that all forward-looking statements be subject to the safe-harbor provisions of the PSLRA.
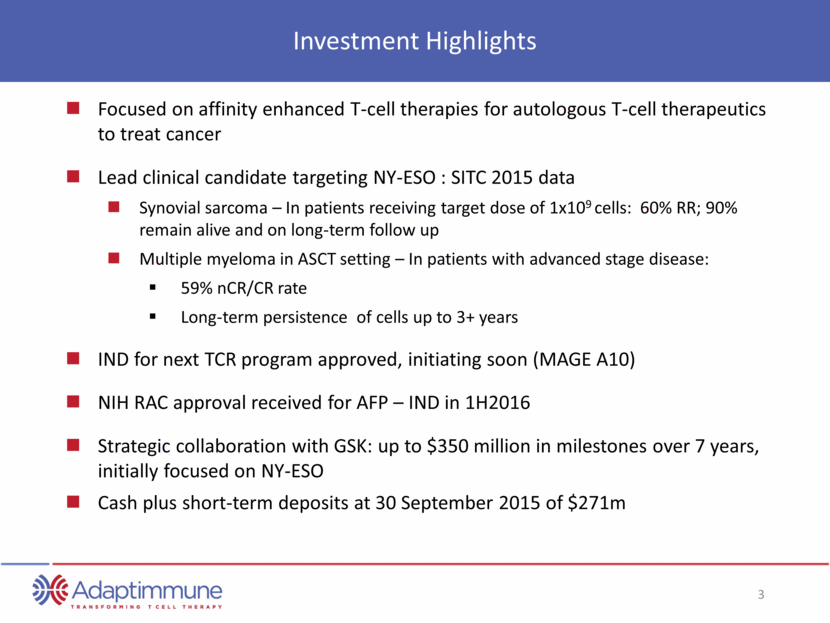
Investment Highlights Focused on affinity enhanced T-cell therapies for autologous T-cell therapeutics to treat cancer Lead clinical candidate targeting NY-ESO : SITC 2015 data Synovial sarcoma – In patients receiving target dose of 1x10⁹ cells: 60% RR; 90% remain alive and on long-term follow up Multiple myeloma in ASCT setting – In patients with advanced stage disease: 59% nCR/CR rate Long-term persistence of cells up to 3+ years IND for next TCR program approved, initiating soon (MAGE A10) NIH RAC approval received for AFP – IND in 1H2016 Strategic collaboration with GSK: up to $350 million in milestones over 7 years, initially focused on NY-ESO Cash plus short-term deposits at 30 September 2015 of $271m
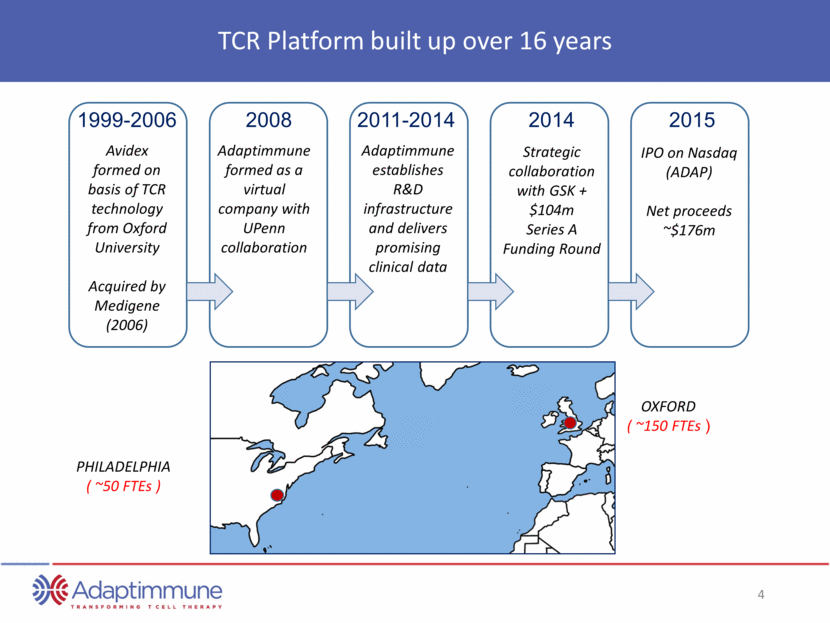
TCR Platform built up over 16 years 1999-2006 Avidex formed on basis of TCR technology from Oxford University Acquired by Medigene (2006) 2008 Adaptimmune formed as a virtual company with UPenn collaboration 2011-2014 Adaptimmune establishes R&D infrastructure and delivers promising clinical data 2014 Strategic collaboration with GSK + $104m Series A Funding Round 2015 IPO on Nasdaq (ADAP) Net proceeds ~$176m PHILADELPHIA ( ~50 FTEs ) OXFORD ( ~150 FTEs )
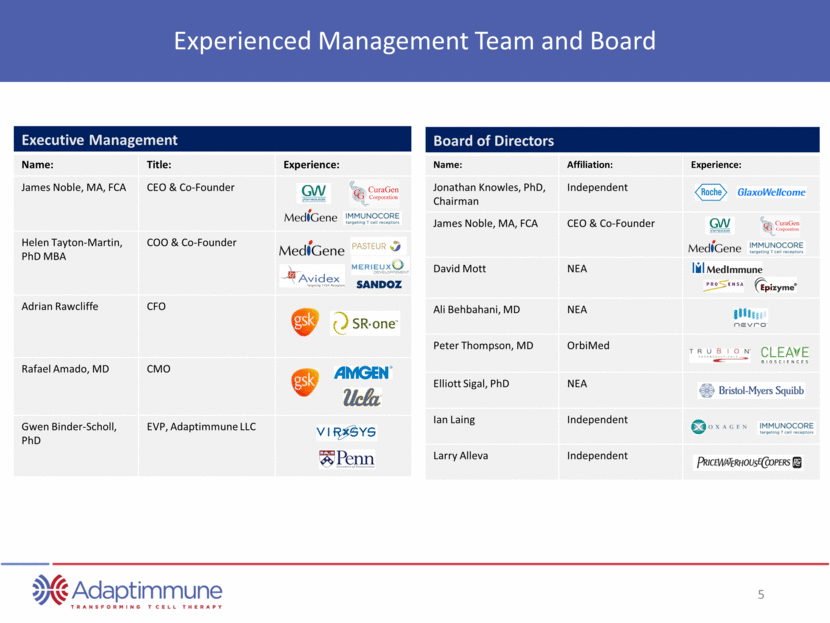
Experienced Management Team and Board Executive Management Name: Title: Experience: James Noble, MA, FCA CEO & Co-Founder Helen Tayton-Martin, PhD MBA COO & Co-Founder Adrian Rawcliffe CFO Rafael Amado, MD CMO Gwen Binder-Scholl, PhD EVP, Adaptimmune LLC Board of Directors Name: Affiliation: Experience: Jonathan Knowles, PhD, Chairman Independent James Noble, MA, FCA CEO & Co-Founder David Mott NEA Ali Behbahani, MD NEA Peter Thompson, MD OrbiMed Elliott Sigal, PhD NEA Ian Laing Independent Larry Alleva Independent
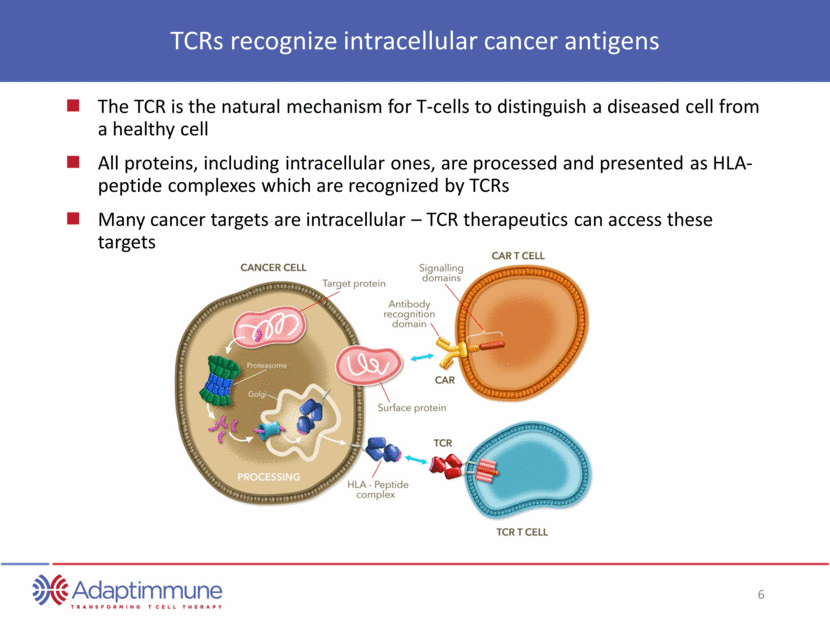
TCRs recognize intracellular cancer antigens The TCR is the natural mechanism for T-cells to distinguish a diseased cell from a healthy cell All proteins, including intracellular ones, are processed and presented as HLA-peptide complexes which are recognized by TCRs Many cancer targets are intracellular – TCR therapeutics can access these targets
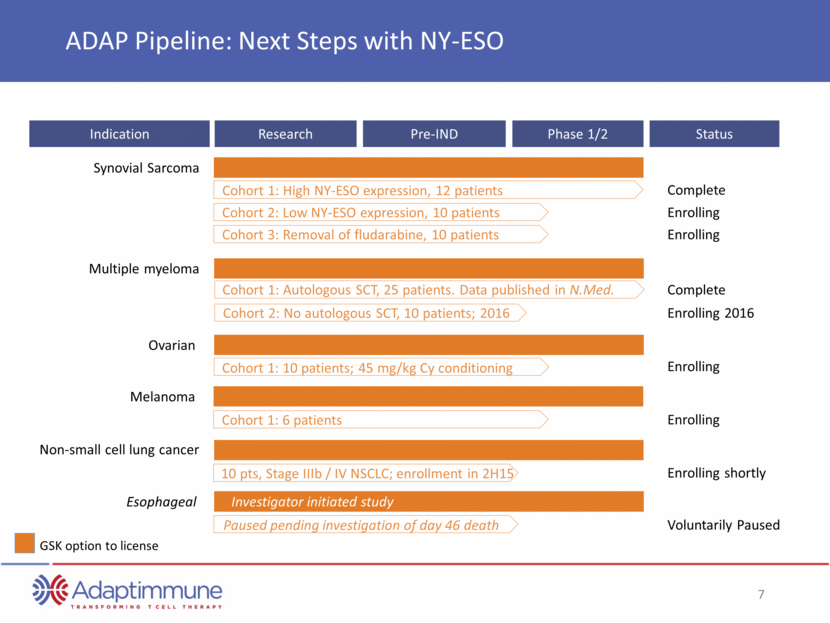
Indication Research Pre-IND Phase 1/2 GSK option to license ADAP Pipeline: Next Steps with NY-ESO Cohort 1: High NY-ESO expression, 12 patients Esophageal Synovial Sarcoma Cohort 2: Low NY-ESO expression, 10 patients Cohort 3: Removal of fludarabine, 10 patients Cohort 1: Autologous SCT, 25 patients. Data published in N.Med. Multiple myeloma Cohort 2: No autologous SCT, 10 patients; 2016 Cohort 1: 10 patients; 45 mg/kg Cy conditioning Ovarian Synovial Sarcoma Cohort 1: 6 patients Melanoma Paused pending investigation of day 46 death Esophageal Non-small cell lung cancer 10 pts, Stage IIIb / IV NSCLC; enrollment in 2H15 Investigator initiated study Status Complete Enrolling Enrolling Complete Enrolling 2016 Enrolling Enrolling Enrolling shortly Voluntarily Paused
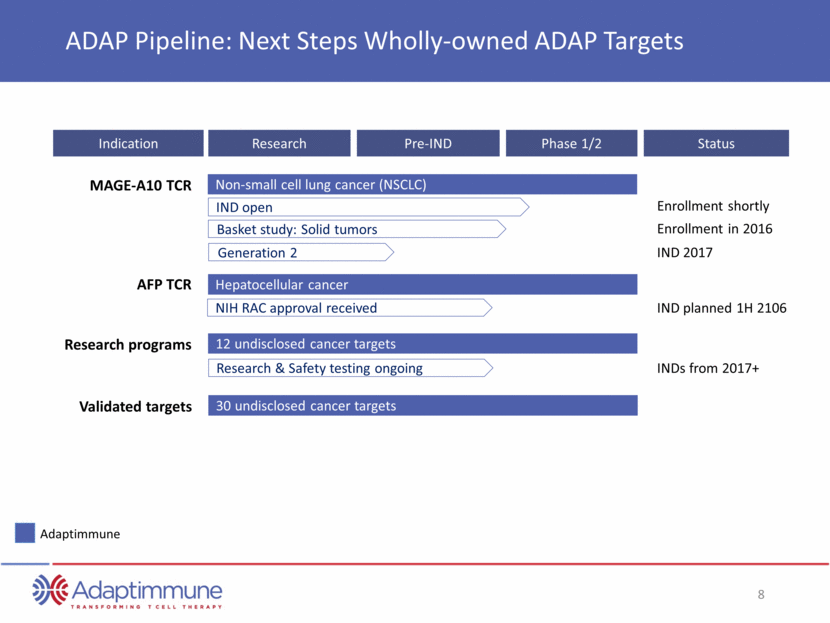
MAGE-A10 TCR Indication Research Pre-IND Phase 1/2 ADAP Pipeline: Next Steps Wholly-owned ADAP Targets IND open Non-small cell lung cancer (NSCLC) Basket study: Solid tumors NIH RAC approval received Hepatocellular cancer Synovial Sarcoma 12 undisclosed cancer targets AFP TCR Research programs Adaptimmune 30 undisclosed cancer targets Validated targets Status Enrollment shortly Enrollment in 2016 IND 2017 IND planned 1H 2106 INDs from 2017+ Generation 2 Research & Safety testing ongoing
Platform and Differentiation
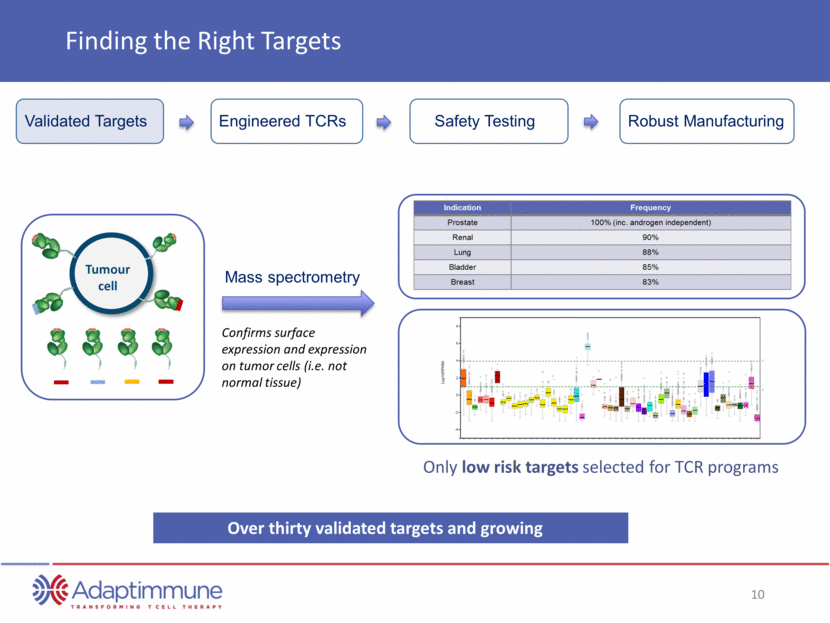
Finding the Right Targets Tumour cell Only low risk targets selected for TCR programs Over thirty validated targets and growing Engineered TCRs Safety Testing Robust Manufacturing Validated Targets Mass spectrometry Confirms surface expression and expression on tumor cells (i.e. not normal tissue) Indication Frequency Prostate 100% (inc. androgen independent) Renal 90% Lung 88% Bladder 85% Breast 83%
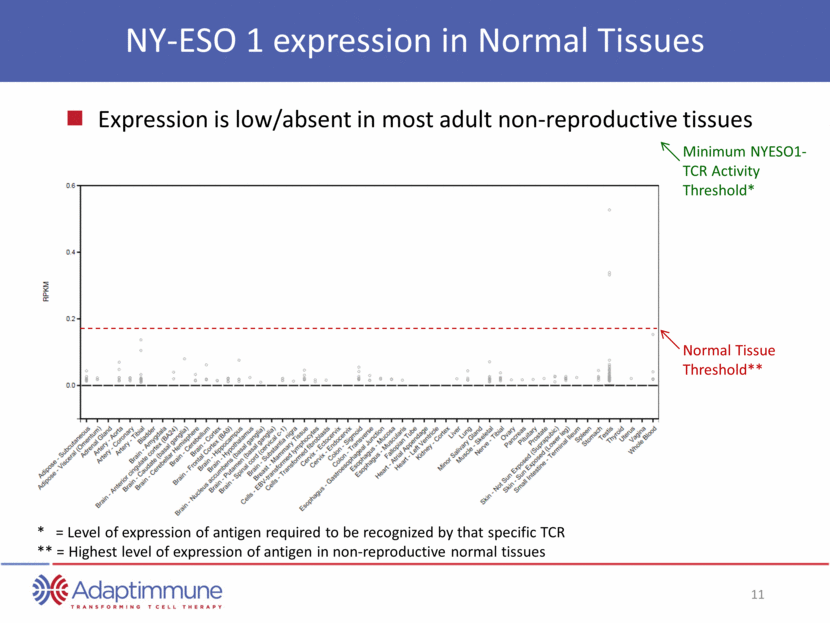
NY-ESO 1 expression in Normal Tissues Expression is low/absent in most adult non-reproductive tissues Minimum NYESO1-TCR Activity Threshold* Normal Tissue Threshold** * = Level of expression of antigen required to be recognized by that specific TCR ** = Highest level of expression of antigen in non-reproductive normal tissues
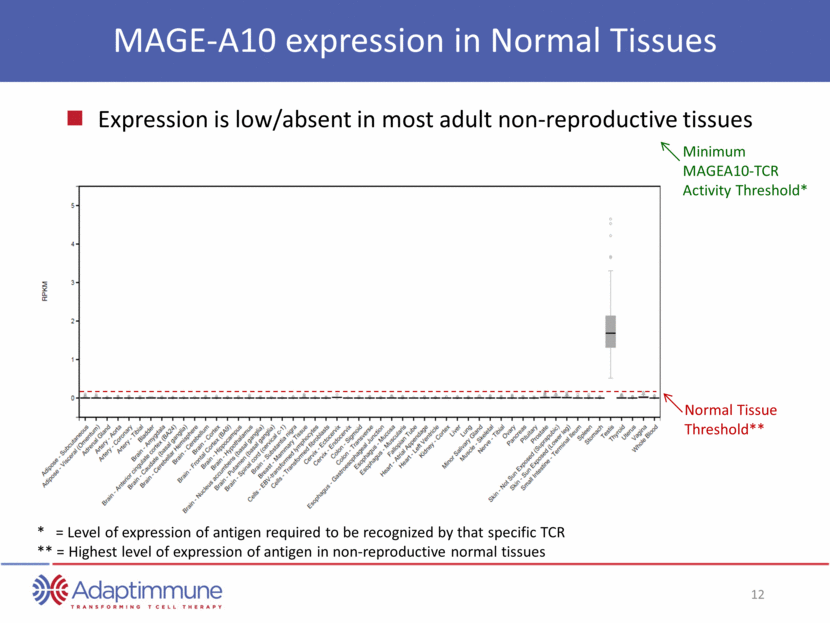
MAGE-A10 expression in Normal Tissues Expression is low/absent in most adult non-reproductive tissues Normal Tissue Threshold** Minimum MAGEA10-TCR Activity Threshold* * = Level of expression of antigen required to be recognized by that specific TCR ** = Highest level of expression of antigen in non-reproductive normal tissues
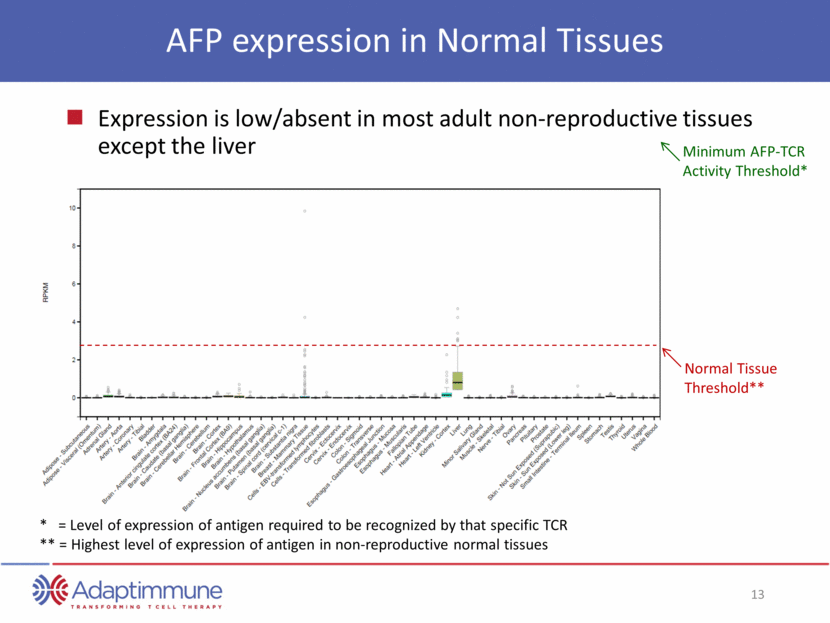
AFP expression in Normal Tissues Expression is low/absent in most adult non-reproductive tissues except the liver Minimum AFP-TCR Activity Threshold* Normal Tissue Threshold** * = Level of expression of antigen required to be recognized by that specific TCR ** = Highest level of expression of antigen in non-reproductive normal tissues
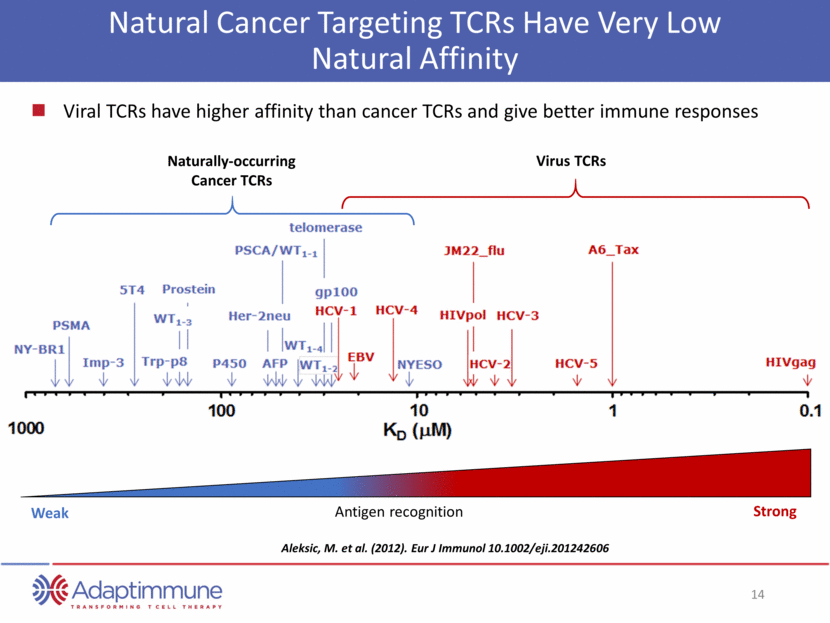
Natural Cancer Targeting TCRs Have Very Low Natural Affinity Aleksic, M. et al. (2012). Eur J Immunol 10.1002/eji.201242606 Strong Weak Antigen recognition Virus TCRs Naturally-occurring Cancer TCRs Viral TCRs have higher affinity than cancer TCRs and give better immune responses
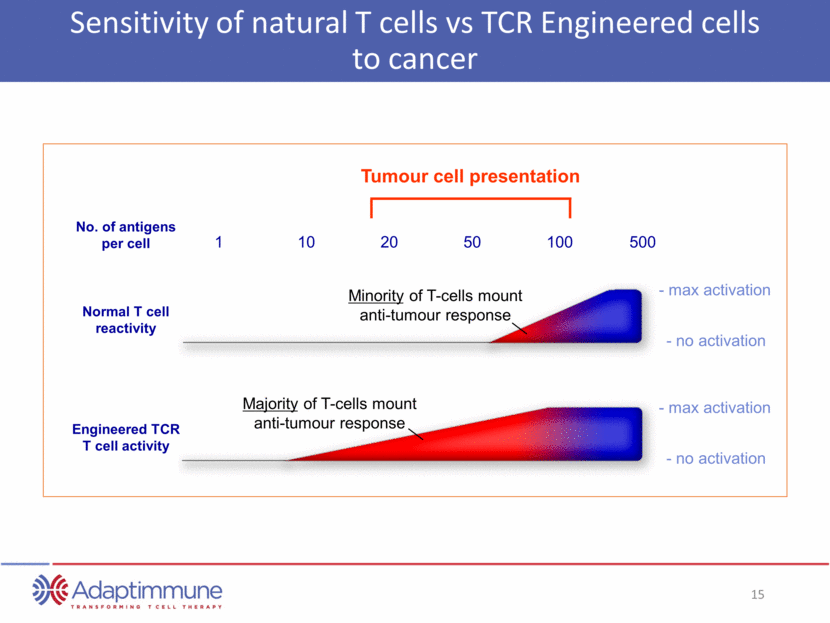
Sensitivity of natural T cells vs TCR Engineered cells to cancer Engineered TCR T cell activity Normal T cell reactivity No. of antigens per cell 1 10 20 50 100 500 - max activation - no activation - max activation - no activation Minority of T-cells mount anti-tumour response Majority of T-cells mount anti-tumour response Tumour cell presentation
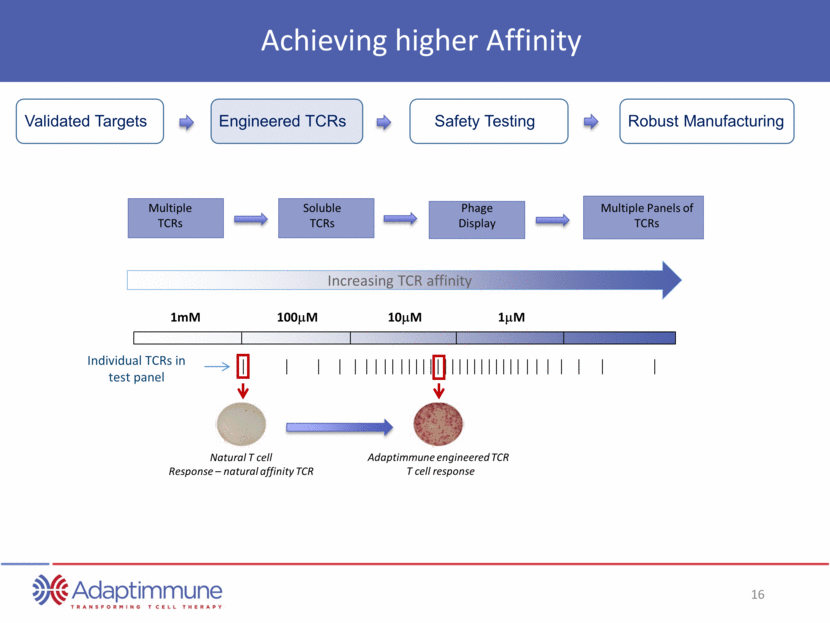
Achieving higher Affinity Safety Testing Robust Manufacturing Validated Targets Engineered TCRs 1mM 100mM 10mM 1mM Individual TCRs in test panel Natural T cell Response – natural affinity TCR Adaptimmune engineered TCR T cell response Increasing TCR affinity Soluble TCRs Phage Display Multiple Panels of TCRs Multiple TCRs
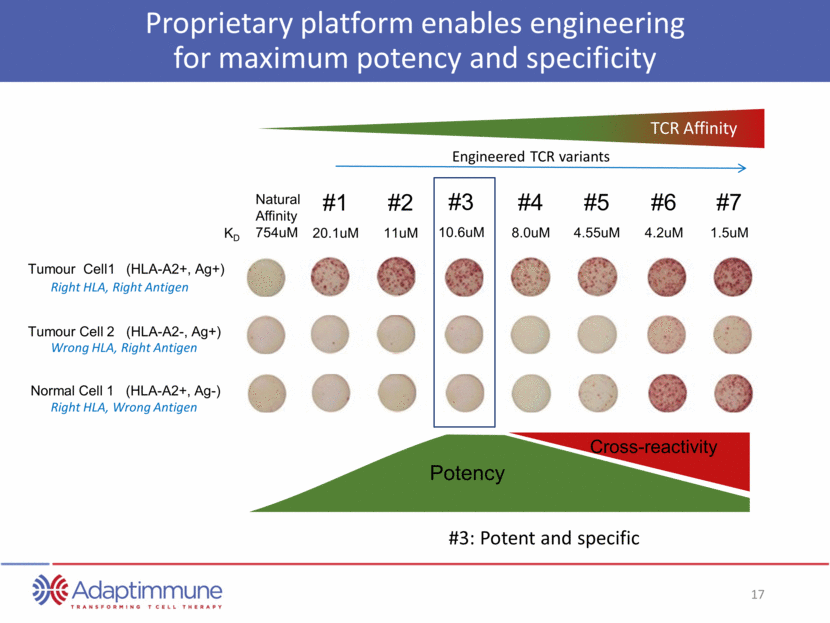
Proprietary platform enables engineering for maximum potency and specificity #1 20.1uM #2 11uM #3 10.6uM #4 8.0uM #5 4.55uM #6 4.2uM #7 1.5uM Natural Affinity 754uM Engineered TCR variants KD Tumour Cell1 (HLA-A2+, Ag+) Tumour Cell 2 (HLA-A2-, Ag+) Normal Cell 1 (HLA-A2+, Ag-) Right HLA, Right Antigen Wrong HLA, Right Antigen Right HLA, Wrong Antigen #3: Potent and specific Potency Cross-reactivity TCR Affinity
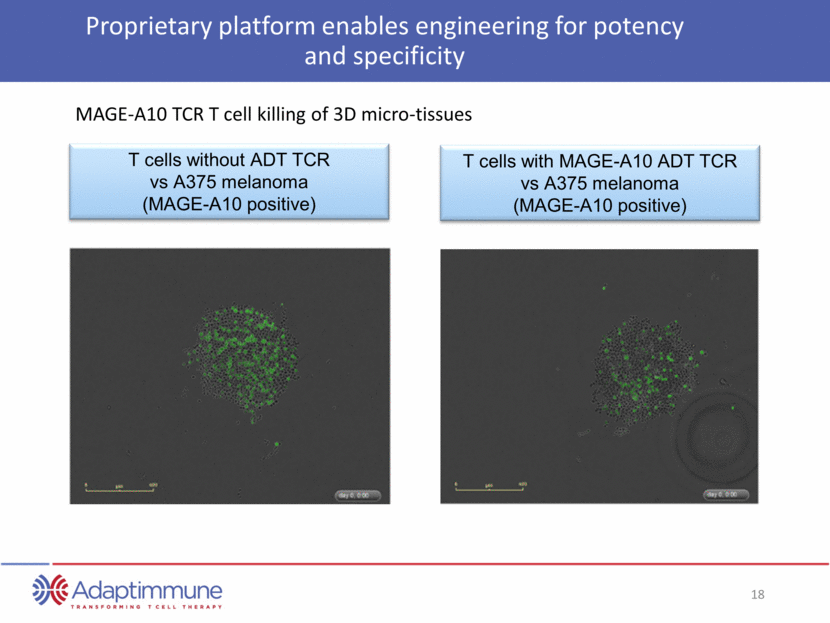
Proprietary platform enables engineering for potency and specificity T cells without ADT TCR vs A375 melanoma (MAGE-A10 positive) T cells with MAGE-A10 ADT TCR vs A375 melanoma (MAGE-A10 positive) MAGE-A10 TCR T cell killing of 3D micro-tissues
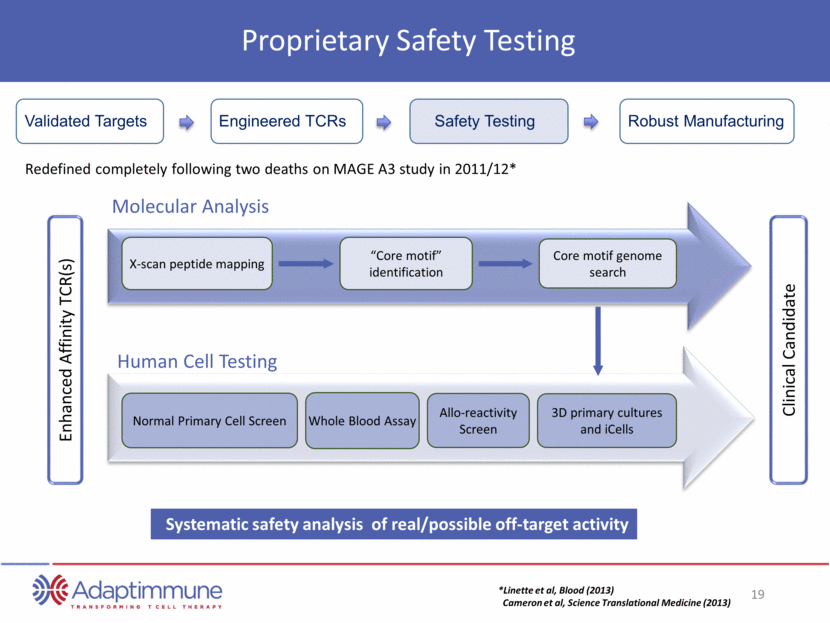
3D primary cultures and iCells Normal Primary Cell Screen Molecular Analysis Human Cell Testing Whole Blood Assay Allo-reactivity Screen “Core motif” identification Core motif genome search X-scan peptide mapping Redefined completely following two deaths on MAGE A3 study in 2011/12* *Linette et al, Blood (2013) Cameron et al, Science Translational Medicine (2013) Clinical Candidate Enhanced Affinity TCR(s) Systematic safety analysis of real/possible off-target activity Proprietary Safety Testing Engineered TCRs Safety Testing Robust Manufacturing Validated Targets
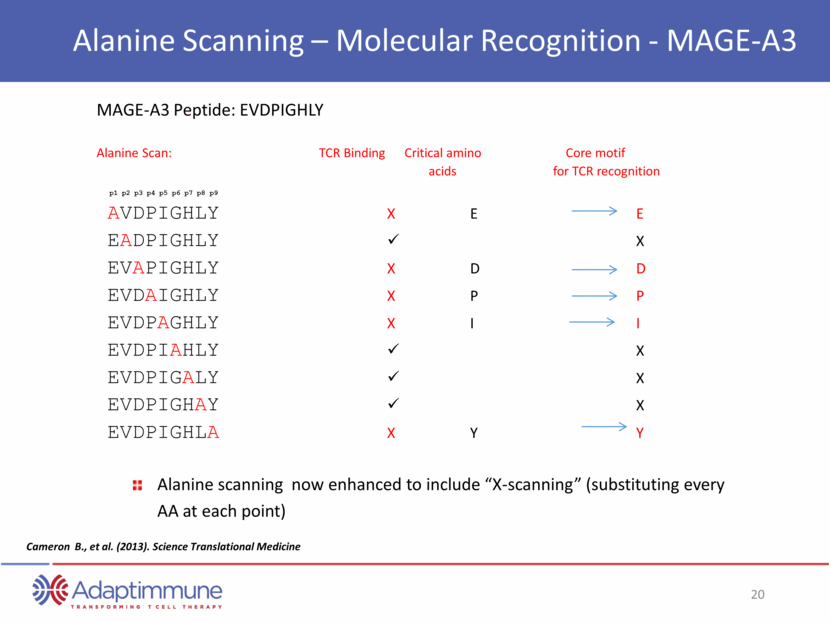
Alanine Scanning – Molecular Recognition - MAGE-A3 MAGE-A3 Peptide: EVDPIGHLY Alanine Scan: TCR Binding Critical amino Core motif acids for TCR recognition AVDPIGHLY X E E EADPIGHLY X EVAPIGHLY X D D EVDAIGHLY X P P EVDPAGHLY X I I EVDPIAHLY X EVDPIGALY X EVDPIGHAY X EVDPIGHLA X Y Y p1 p2 p3 p4 p5 p6 p7 p8 p9 Cameron B., et al. (2013). Science Translational Medicine Alanine scanning now enhanced to include “X-scanning” (substituting every AA at each point)
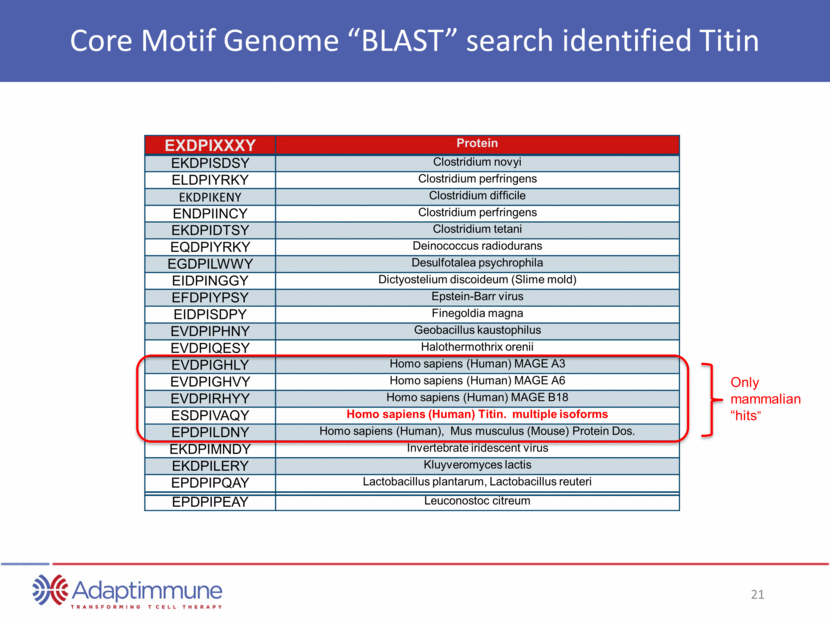
Core Motif Genome “BLAST” search identified Titin EXDPIXXXY Protein EKDPISDSY Clostridium novyi ELDPIYRKY Clostridium perfringens EKDPIKENY Clostridium difficile ENDPIINCY Clostridium perfringens EKDPIDTSY Clostridium tetani EQDPIYRKY Deinococcus radiodurans EGDPILWWY Desulfotalea psychrophila EIDPINGGY Dictyostelium discoideum (Slime mold) EFDPIYPSY Epstein-Barr virus EIDPISDPY Finegoldia magna EVDPIPHNY Geobacillus kaustophilus EVDPIQESY Halothermothrix orenii EVDPIGHLY Homo sapiens (Human) MAGE A3 EVDPIGHVY Homo sapiens (Human) MAGE A6 EVDPIRHYY Homo sapiens (Human) MAGE B18 ESDPIVAQY Homo sapiens (Human) Titin. multiple isoforms EPDPILDNY Homo sapiens (Human), Mus musculus (Mouse) Protein Dos. EKDPIMNDY Invertebrate iridescent virus EKDPILERY Kluyveromyces lactis EPDPIPQAY Lactobacillus plantarum, Lactobacillus reuteri EPDPIPEAY Leuconostoc citreum Only mammalian “hits”
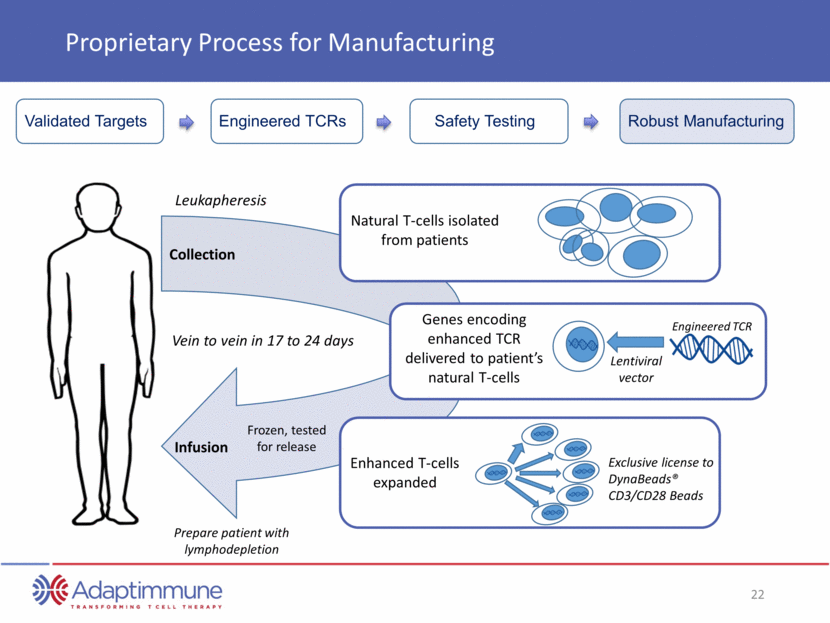
Proprietary Process for Manufacturing Leukapheresis Prepare patient with lymphodepletion Collection Infusion Natural T-cells isolated from patients Genes encoding enhanced TCR delivered to patient’s natural T-cells Lentiviral vector Enhanced T-cells expanded Exclusive license to DynaBeads® CD3/CD28 Beads Vein to vein in 17 to 24 days Frozen, tested for release Engineered TCR Engineered TCRs Safety Testing Robust Manufacturing Validated Targets
NY-ESO in Synovial Sarcoma
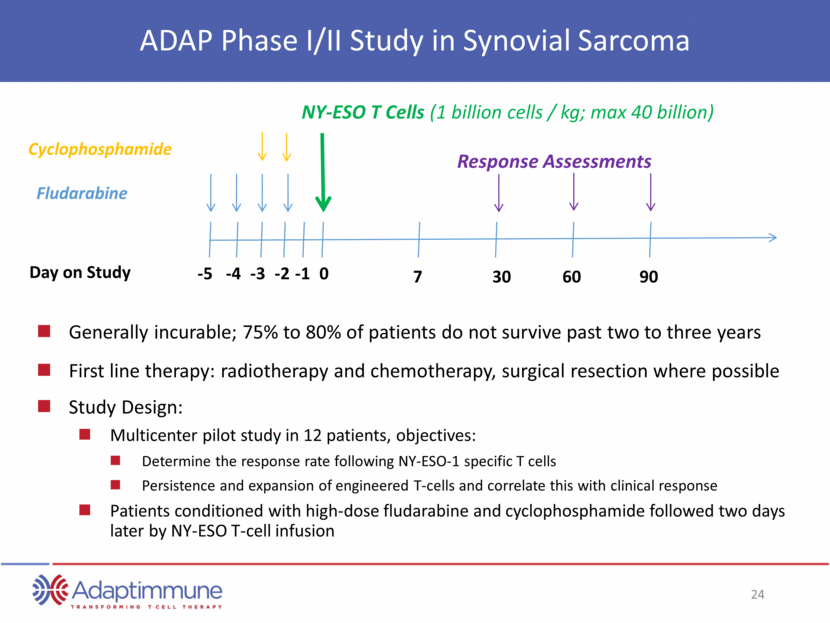
ADAP Phase I/II Study in Synovial Sarcoma Generally incurable; 75% to 80% of patients do not survive past two to three years First line therapy: radiotherapy and chemotherapy, surgical resection where possible Study Design: Multicenter pilot study in 12 patients, objectives: Determine the response rate following NY-ESO-1 specific T cells Persistence and expansion of engineered T-cells and correlate this with clinical response Patients conditioned with high-dose fludarabine and cyclophosphamide followed two days later by NY-ESO T-cell infusion Fludarabine Cyclophosphamide -5 -4 -3 -2 -1 0 NY-ESO T Cells (1 billion cells / kg; max 40 billion) 7 30 60 90 Day on Study Response Assessments
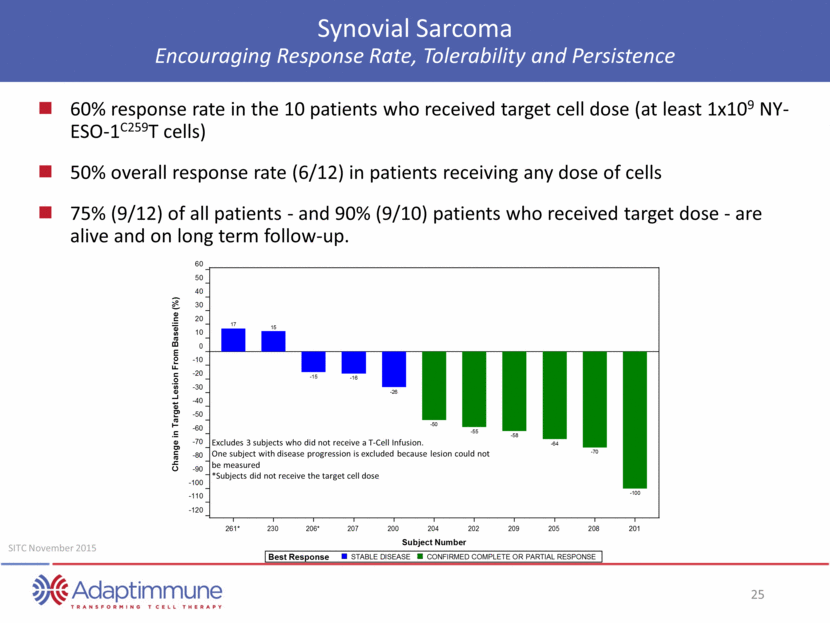
Synovial Sarcoma Encouraging Response Rate, Tolerability and Persistence 60% response rate in the 10 patients who received target cell dose (at least 1x10⁹ NY-ESO-1C259T cells) 50% overall response rate (6/12) in patients receiving any dose of cells 75% (9/12) of all patients - and 90% (9/10) patients who received target dose - are alive and on long term follow-up. Excludes 3 subjects who did not receive a T-Cell Infusion. One subject with disease progression is excluded because lesion could not be measured *Subjects did not receive the target cell dose SITC November 2015 60 50 40 30 20 10 0 - 10 - 20 - 30 - 40 - 50 - 60 - 70 - 80 - 90 - 100 - 110 - 120 261* 230 206* 207 200 204 202 209 205 208 201 Subject Number Best Response STABLE DISEASE CONFIRMED COMPLETE OR PARTIAL RESPONSE 17 15 - 15 - 16 - 26 - 50 - 55 - 58 - 64 - 70 - 100 Change in Target Lesion From Base line (%)
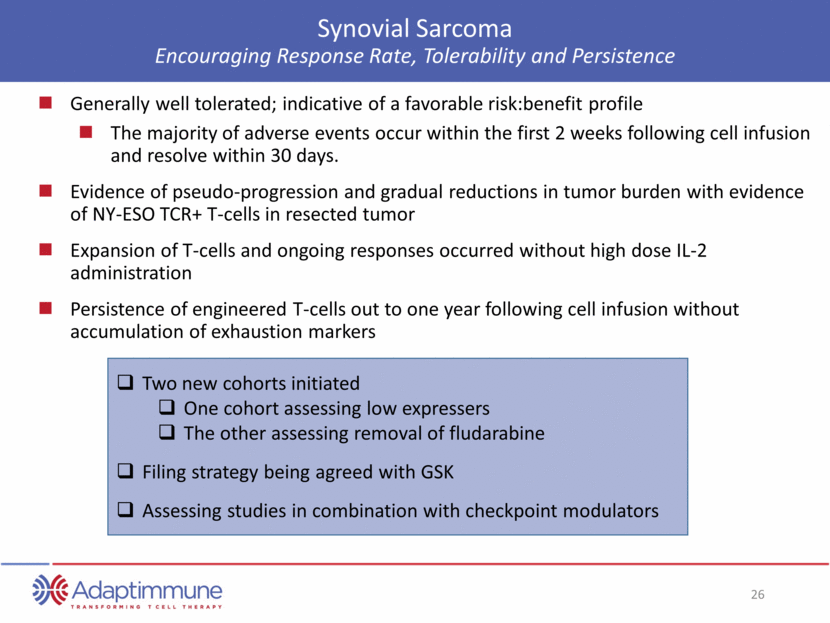
Synovial Sarcoma Encouraging Response Rate, Tolerability and Persistence Generally well tolerated; indicative of a favorable risk:benefit profile The majority of adverse events occur within the first 2 weeks following cell infusion and resolve within 30 days. Evidence of pseudo-progression and gradual reductions in tumor burden with evidence of NY-ESO TCR+ T-cells in resected tumor Expansion of T-cells and ongoing responses occurred without high dose IL-2 administration Persistence of engineered T-cells out to one year following cell infusion without accumulation of exhaustion markers Two new cohorts initiated One cohort assessing low expressers The other assessing removal of fludarabine Filing strategy being agreed with GSK Assessing studies in combination with checkpoint modulators
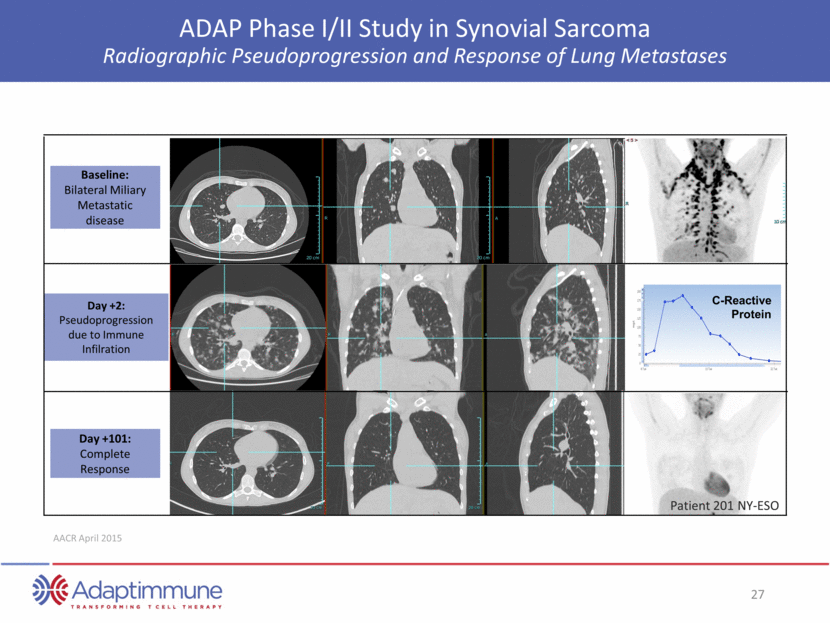
ADAP Phase I/II Study in Synovial Sarcoma Radiographic Pseudoprogression and Response of Lung Metastases Baseline: Bilateral Miliary Metastatic disease Day +2: Pseudoprogression due to Immune Infilration Day +101: Complete Response Patient 201 NY-ESO C-Reactive Protein AACR April 2015
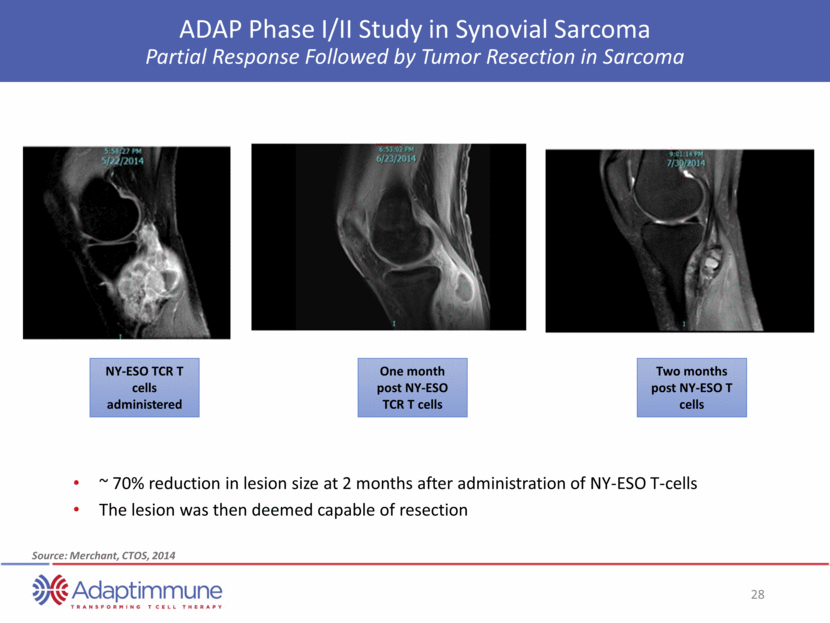
NY-ESO TCR T cells administered ADAP Phase I/II Study in Synovial Sarcoma Partial Response Followed by Tumor Resection in Sarcoma One month post NY-ESO TCR T cells Two months post NY-ESO T cells Source: Merchant, CTOS, 2014 ~ 70% reduction in lesion size at 2 months after administration of NY-ESO T-cells The lesion was then deemed capable of resection
NY-ESO in Multiple Myeloma

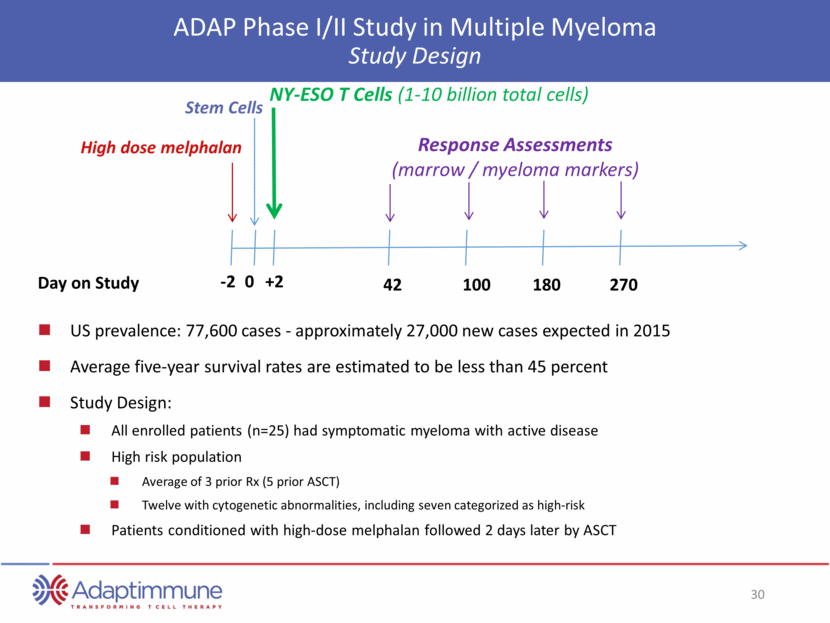
ADAP Phase I/II Study in Multiple Myeloma Study Design US prevalence: 77,600 cases - approximately 27,000 new cases expected in 2015 Average five-year survival rates are estimated to be less than 45 percent Study Design: All enrolled patients (n=25) had symptomatic myeloma with active disease High risk population Average of 3 prior Rx (5 prior ASCT) Twelve with cytogenetic abnormalities, including seven categorized as high-risk Patients conditioned with high-dose melphalan followed 2 days later by ASCT Stem Cells High dose melphalan -2 0 +2 NY-ESO T Cells (1-10 billion total cells) 42 100 180 270 Day on Study Response Assessments (marrow / myeloma markers)
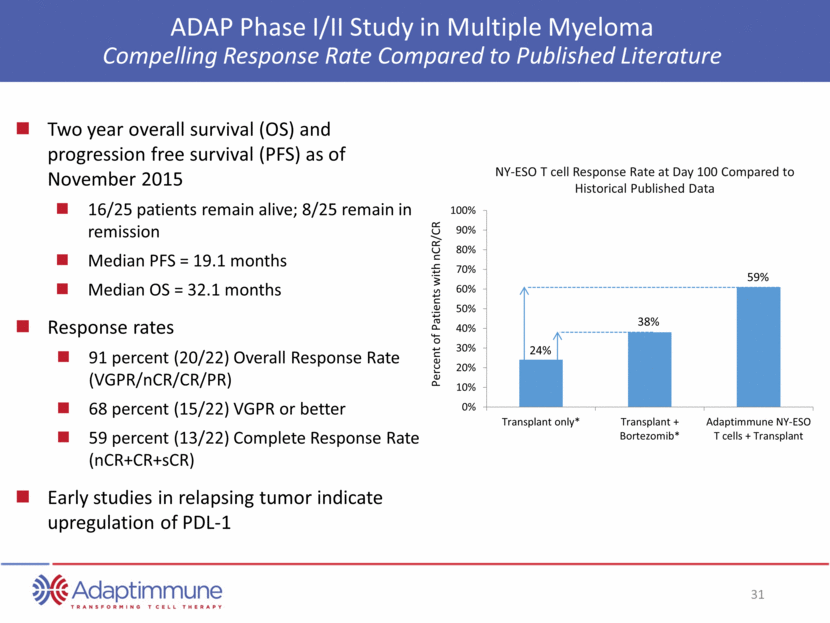
ADAP Phase I/II Study in Multiple Myeloma Compelling Response Rate Compared to Published Literature Two year overall survival (OS) and progression free survival (PFS) as of November 2015 16/25 patients remain alive; 8/25 remain in remission Median PFS = 19.1 months Median OS = 32.1 months Response rates 91 percent (20/22) Overall Response Rate (VGPR/nCR/CR/PR) 68 percent (15/22) VGPR or better 59 percent (13/22) Complete Response Rate (nCR+CR+sCR) Early studies in relapsing tumor indicate upregulation of PDL-1 Percent of Patients with nCR/CR NY-ESO T cell Response Rate at Day 100 Compared to Historical Published Data 24% 38% 59% 0% 10% 20% 30% 40% 50% 60% 70% 80% 90% 100% Transplant only* Transplant + Bortezomib* Adaptimmune NY-ESO T cells + Transplant
ADAP Phase I/II Study in Multiple Myeloma Encouraging Tolerability and Persistence Generally well tolerated; indicative of a favorable risk:benefit profile All SAEs possibly related to the NY-ESO T-cells resolved No clinically apparent cytokine release syndrome despite high IL-6 levels CAR-Ts have been associated with severe adverse events attributable in part to grade 3 or 4 cytokine release syndrome No need for high dose IL-2 to support engineered T-cell persistence Prolonged persistence and trafficking of cells detected Infused cells remain functional, without exhaustion, and include a diversity of phenotypes
MAGE-A10 Proprietary target
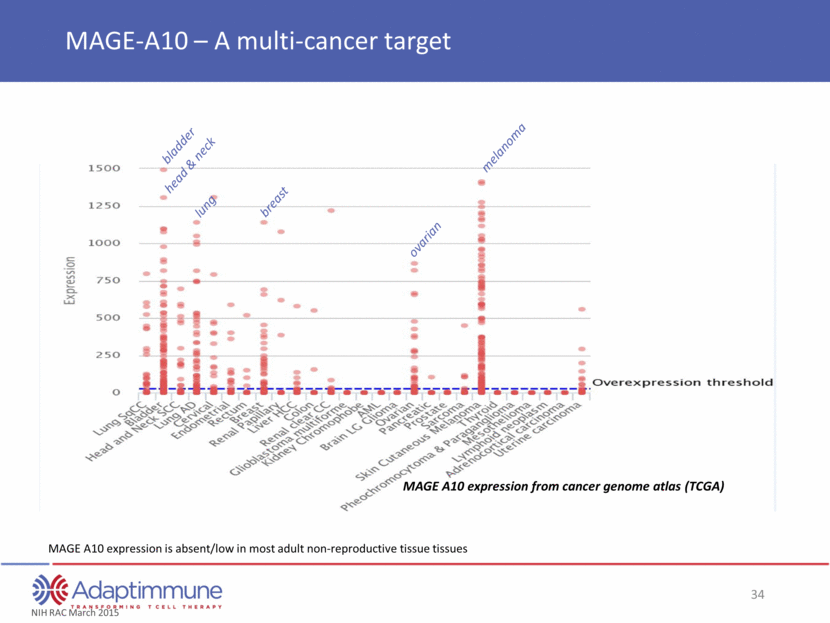
MAGE A10 expression from cancer genome atlas (TCGA) breast bladder lung head & neck melanoma ovarian NIH RAC March 2015 MAGE-A10 – A multi-cancer target MAGE A10 expression is absent/low in most adult non-reproductive tissue tissues
IND for MAGE-A10 TCR therapeutic filed Preclinical testing complete NIH RAC approval obtained: March 10, 2015 IND approved: announced July 2, 2015 Initial trial in NSCLC expected to open in 2015 Basket study anticipated in 2016 in multiple cancers potentially including bladder, head and neck, breast and GI cancers.
MAGE-A10 TCR Indication Research Pre-IND Phase 1/2 ADAP Pipeline: Next Steps Wholly-owned ADAP Targets IND open Non-small cell lung cancer (NSCLC) Basket study: Solid tumors NIH RAC approval received Hepatocellular cancer Synovial Sarcoma 12 undisclosed cancer targets AFP TCR Research programs Adaptimmune 30 undisclosed cancer targets Validated targets Status Enrollment shortly Enrollment in 2016 IND 2017 IND planned 1H 2106 INDs from 2017+ Generation 2 Research & Safety testing ongoing

GSK Collaboration
The GSK Strategic Collaboration Announced June 2014: Up-front payment £25 million GSK has option to license NY-ESO at end of Phase 1/2 studies Adaptimmune conducts all clinical and non-clinical development work Enables Adaptimmune to optimize regulatory, vector, cell processing, analytical, automation, diagnostic, cell improvements, etc. GSK can nominate up to four other targets, but not MAGE A-10, AFP or the designated targets in our research programs Up to $350m in funding and milestones in first seven years Covers milestones for 3 of 5 targets; assuming 2 have MAs filed in US and EU First four milestones already reached Royalties (mid-single to low double digit) and sales milestones payable
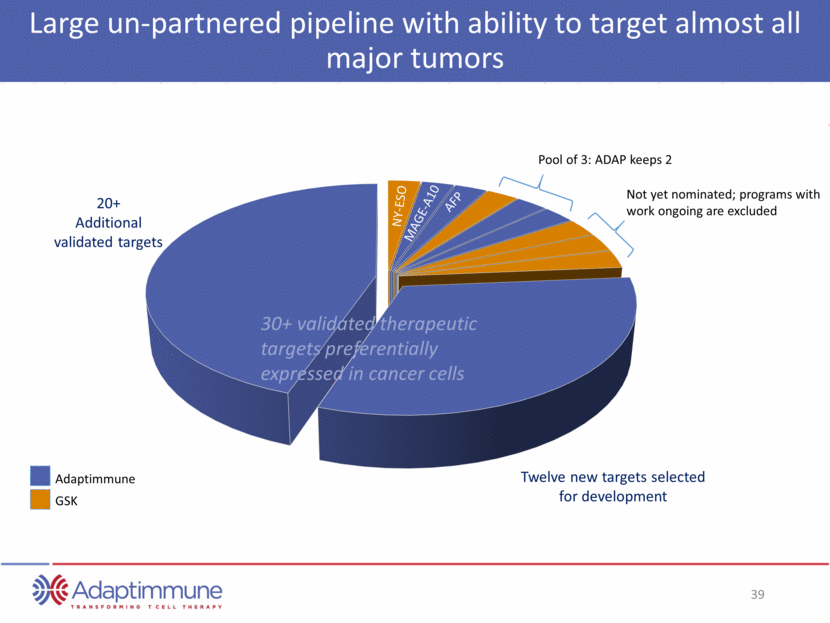
Large un-partnered pipeline with ability to target almost all major tumors Adaptimmune GSK 20+ Additional validated targets Twelve new targets selected for development Not yet nominated; programs with work ongoing are excluded Pool of 3: ADAP keeps 2 NY-ESO MAGE-A10 AFP 30+ validated therapeutic targets preferentially expressed in cancer cells
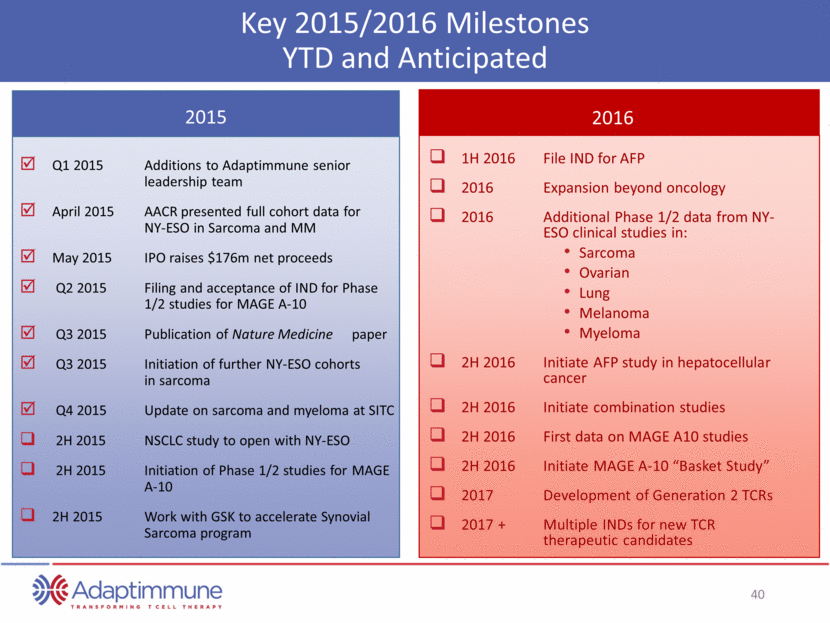
Key 2015/2016 Milestones YTD and Anticipated Q1 2015 Additions to Adaptimmune senior leadership team April 2015 AACR presented full cohort data for NY-ESO in Sarcoma and MM May 2015 IPO raises $176m net proceeds Q2 2015 Filing and acceptance of IND for Phase 1/2 studies for MAGE A-10 Q3 2015 Publication of Nature Medicine paper Q3 2015 Initiation of further NY-ESO cohorts in sarcoma Q4 2015 Update on sarcoma and myeloma at SITC 2H 2015 NSCLC study to open with NY-ESO 2H 2015 Initiation of Phase 1/2 studies for MAGE A-10 2H 2015 Work with GSK to accelerate Synovial Sarcoma program 1H 2016 File IND for AFP 2016 Expansion beyond oncology 2016 Additional Phase 1/2 data from NY- ESO clinical studies in: Sarcoma Ovarian Lung Melanoma Myeloma 2H 2016 Initiate AFP study in hepatocellular cancer 2H 2016 Initiate combination studies 2H 2016 First data on MAGE A10 studies 2H 2016 Initiate MAGE A-10 “Basket Study” 2017 Development of Generation 2 TCRs 2017 + Multiple INDs for new TCR therapeutic candidates 2015 2016
Investment Highlights Focused on affinity enhanced T-cell therapies for autologous T-cell therapeutics to treat cancer Lead clinical candidate targeting NY-ESO : SITC 2015 data Synovial sarcoma – In patients receiving target dose of 1x10⁹ cells: 60% RR; 90% remain alive and on long-term follow up Multiple myeloma in ASCT setting – In patients with advanced stage disease: 59% nCR/CR rate Long-term persistence of cells up to 3+ years IND for next TCR program approved, initiating soon (MAGE A10) NIH RAC approval received for AFP – IND in 1H2016 Strategic collaboration with GSK: up to $350 million in milestones over 7 years, initially focused on NY-ESO Cash plus short-term deposits at 30 September 2015 of $271m
Adaptimmune Engineered TCR T cell therapy Jefferies Autumn Global Healthcare Conference 18th November 2015