Exhibit 99.1
Adaptimmune investor and analyst day 2016 April 22, 2016
Exhibit 99.1
Adaptimmune investor and analyst day 2016 April 22, 2016
disclaimer This presentation contains “forward-looking statements,” as that term is defined under the Private Securities Litigation Reform Act of 1995 (PSLRA), which statements may be identified by words such as “believe,” “may”, “will,” “estimate,” “continue,” “anticipate,” “intend,” “expect” and other words of similar meaning. These forward-looking statements involve certain risks and uncertainties. Such risks and uncertainties could cause our actual results to differ materially from those indicated by such forward-looking statements, and include, without limitation: the success, cost and timing of our product development activities and clinical trials; our ability to submit an IND and successfully advance our technology platform to improve the safety and effectiveness of our existing TCR therapeutic candidates; the rate and degree of market acceptance of T-cell therapy generally and of our TCR therapeutic candidates; government regulation and approval, including, but not limited to, the expected regulatory approval timelines for TCR therapeutic candidates; and our ability to protect our proprietary technology and enforce our intellectual property rights; amongst others. For a further description of the risks and uncertainties that could cause our actual results to differ materially from those expressed in these forward-looking statements, as well as risks relating to our business in general, we refer you to our Annual Report on Form 20-F filed with the Securities and Exchange Commission (SEC) on October 13, 2015 and our other SEC filings. We urge you to consider these factors carefully in evaluating the forward-looking statements herein and are cautioned not to place undue reliance on such forward-looking statements, which are qualified in their entirety by this cautionary statement. The forward-looking statements contained in this presentation speak only as of the date the statements were made and we do not undertake any obligation to update such forward-looking statements to reflect subsequent events or circumstances. We intend that all forward-looking statements be subject to the safe-harbor provisions of the PSLRA. 2
Adaptimmune investor and analyst day 2016 April 22, 2016 James Noble Chief Executive Officer
Today’s agenda Helen Tayton-Martin, PhD, MBA; Chief Operating Officer, Adaptimmune The Role of T Cells in the Immuno-Oncology Landscape Bent Jakobsen, PhD; Scientific Founder, Adaptimmune SPEAR T Cells™: Adaptimmune’s Proprietary Technology Platform Stephan Grupp, MD, PhD; U.Penn Perelman School of Medicine Adoptive T Cell Therapy: Clinical Activity of NY-ESO-1 in a Solid Tumor Aaron Rapoport, MD; U.Md Marlene & Stuart Greenebaum School of Medicine NY-ESO-1 T Cell therapy in Multiple Myeloma: Long Term Efficacy and Persistence Gwen Binder-Scholl, PhD; Chief Technology Officer, Adaptimmune The Adaptimmune Pipeline Engine Manufacturing Excellence and Commercial Delivery Rafael Amado, MD; Chief Medical Officer, Adaptimmune Update on Progress with NY-ESO TCR Accelerating Adaptimmune’s Wholly-Owned Clinical Pipeline 4
Adaptimmune: Leading the TCR T cell space Proprietary SPEAR T cell technology uniquely delivers: Correctly identified targets Specificity and optimal affinity “Supra-natural” TCRs to accelerate programs Enhanced effectiveness of TCRs Generation 2 and 3 TCRs No other company can currently deliver all of these New data on the above are being presented today 5 Clear scientific leadership in the field of T cell engineering
Adaptimmune: Leading the TCR T cell space Multiple clinical responses in synovial sarcoma, a solid tumor Large solid lesions resolved Breakthrough status Pivotal trial planned for around year end 2016 Over 90% response rate in multiple myeloma study in conjunction with ASCT No other company is as far advanced as Adaptimmune in the clinic with a TCR T cell New updates presented on both diseases today 6 Clear scientific leadership in the field of T cell engineering Most compelling clinical data in the field
Adaptimmune: Leading the TCR T cell space Company INDs open for NY-ESO, MAGE-A10 and AFP Next company INDs due 2017 These TCRs all derive from Adaptimmune’s proprietary technology No other company has routinely delivered INDs from an in-house TCR platform Today, we will disclose: Our next IND target The pipeline coverage of tumors 7 Clear scientific leadership in the field of T cell engineering Most compelling clinical data in the field Deep pipeline across major cancers
Adaptimmune: Leading the TCR T cell space Current capital can fund the business through mid-2018 8 Clear scientific leadership in the field of T cell engineering Most compelling clinical data in the field Deep pipeline across major cancers Strong financial position
Adaptimmune: Leading the TCR T cell space Three INDs open Manufacturing processes optimized Goal: first TCR T cell therapy to market 9 Clear scientific leadership in the field of T cell engineering Most compelling clinical data in the field Deep pipeline across major cancers Proven ability to execute Strong financial position
Building a leader A history of scientific pre-eminence Origins of TCR technology 2005-2007 Collaboration with Steve Rosenberg, MD, Ph.D. 2008-2011 Collaboration with U. Penn 2016 + Adaptimmune SAB 1999-2006 2006-2008 2008-TODAY 1993-1999 Academic Research Identifying targets Generating soluble TCRs used in R&D Engineering affinity optimized TCRs Cell Manufacturing TCR intellectual property Oxford IP All IP Adaptimmune spun out as new virtual company in 2008 First soluble TCR Perfected stable soluble TCRs and affinity enhancement First high affinity engineered TCR Avidex bought by Medigene First cell therapy data with affinity optimized TCR First solid tumor data First TCR with breakthrough designation 10 Adaptimmune leadership position in:
Adaptimmune investor and analyst day 2016 The ROLE Of T CELLS IN the Immuno-Oncology Landscape April 22, 2016 Helen Tayton-Martin, PhD, MBA Chief Operating Officer
Why immunotherapy? Cancers Primarily derived from changes to self-proteins Contain many mutations Are heterogeneous, even in the same patient Are good at mutating to avoid selective pressure Deploy a range of tactics to avoid immune system detection Re-establishing T cell recognition and catalysing a polyclonal T cell response is key 12 The key to tackling cancer effectively is immune engagement
EARLY BEGINNINGS WITH TUMOR INFILTRATING LYMPHOCYTES 13 IMMUNOTHERAPY – emerging evidence TIL Therapy
EARLY BEGINNINGS WITH TUMOR INFILTRATING LYMPHOCYTES 14 2005 IMMUNOTHERAPY – emerging evidence TIL therapy can mediate significant tumor regression in patients heavily pre-treated with IL-2 in refractory metastatic melanoma Significant toxicities TIL Therapy
IMMUNOTHERAPY – emerging evidence IMMUNe-MODULATIOn – CHECKPOINT BLOCKADE – ANTI-CTLA-4 15 TIL Therapy Anti-CTLA-4
IMMUNOTHERAPY – emerging evidence IMMUNe-MODULATIOn – CHECKPOINT BLOCKADE – ANTI-CTLA-4 16 Source: Postow, Callahan and Wolchok, J Clin Oncol 2015 33, 1974-1982 Anti-CTLA-4 antibodies block CTLA4 on T cells which disables their ‘brakes’ TIL Therapy Anti-CTLA-4
17 2010 IMMUNOTHERAPY – emerging evidence IMMUNe-MODULATIOn – CHECKPOINT BLOCKADE – ANTI-CTLA-4 1.0 0.9 0.8 0.7 0.6 0.5 0.4 0.3 0.2 0.0 0.0 0 4 8 12 16 20 24 28 32 36 40 44 48 52 56 PROPORTION ALIVE Ipilimumab can cure patients, response rate is low but significant (1/5 get long term survival) Immune-mediated toxicity and adaptive resistance TIL Therapy Anti-CTLA-4
IMMUNOTHERAPY – emerging evidence ANTI-PD-1 – NEXT STEP CHECKPOINT BLOCKADE 18 TIL Therapy Anti-CTLA-4 Anti-PD-1
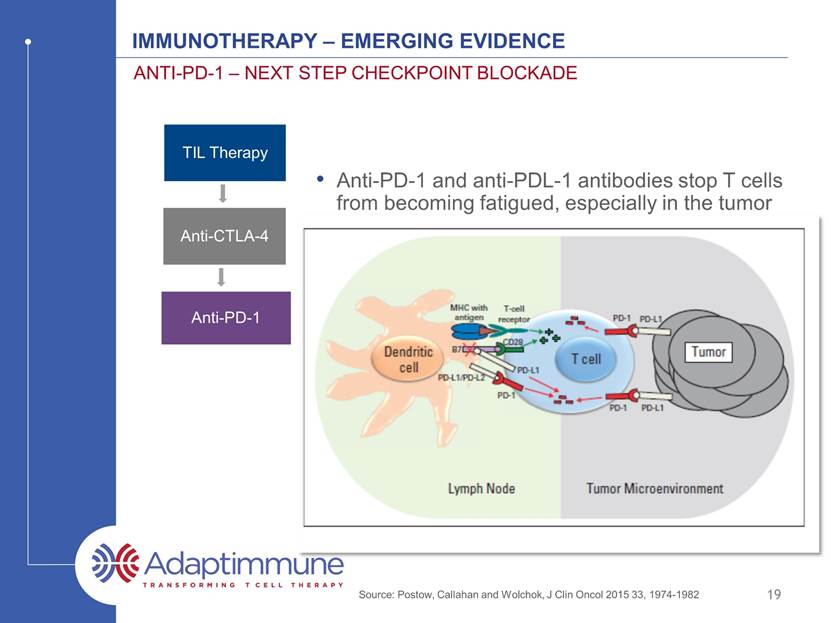
IMMUNOTHERAPY – emerging evidence ANTI-PD-1 – NEXT STEP CHECKPOINT BLOCKADE 19 Source: Postow, Callahan and Wolchok, J Clin Oncol 2015 33, 1974-1982 Anti-PD-1 and anti-PDL-1 antibodies stop T cells encountering fatigue, especially in the tumor TIL Therapy Anti-CTLA-4 Anti-PD-1
20 IMMUNOTHERAPY – emerging evidence ANTI-PD-1 – NEXT STEP CHECKPOINT BLOCKADE Keytruda (anti PD-1 - Melanoma) Source: www.Keytruda.com Clear effects on survival in multiple indications Durable responses, lower toxicity 2015 TIL Therapy Anti-CTLA-4 Anti-PD-1
21 IMMUNOTHERAPY – emerging evidence CHECKPOINt COMBINATIONS TIL Therapy Anti-CTLA-4 Anti-PD-1 Anti-CTLA-4 + Anti-PD-1
22 IMMUNOTHERAPY – emerging evidence CHECKPOINt COMBINATIONS Enhanced effects with multiple immune checkpoint blockade Source: www.Opdivo.com TIL Therapy Anti-CTLA-4 Anti-PD-1 Anti-CTLA-4 + Anti-PD-1
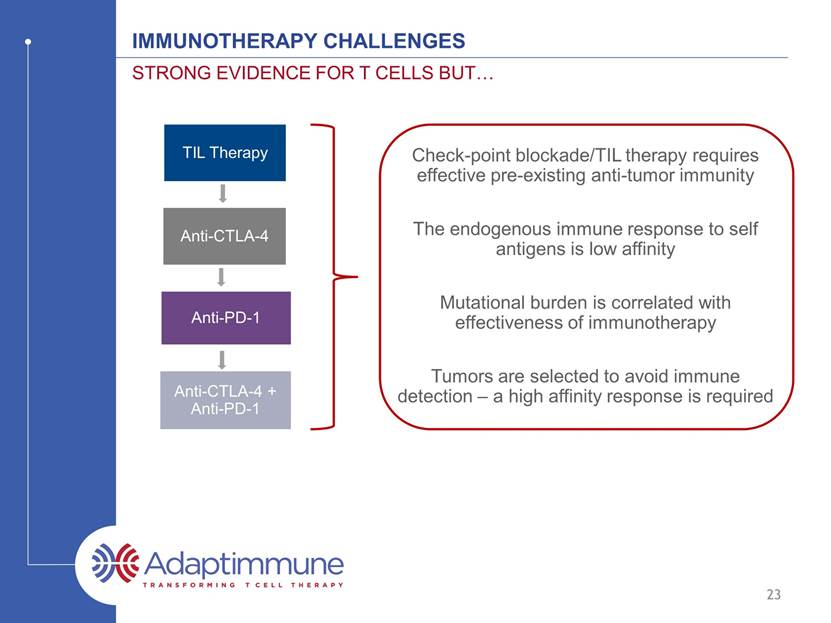
IMMUNOTHERAPY CHALLENGEs Strong evidence for t cells but 23 TIL Therapy Anti-CTLA-4 Anti-PD-1 Anti-CTLA-4 + Anti-PD-1 Check-point blockade/TIL therapy requires effective pre-existing anti-tumor immunity Mutational burden is correlated with effectiveness of immunotherapy The endogenous immune response to self antigens is low affinity Tumors are selected to avoid immune detection – a high affinity response is required
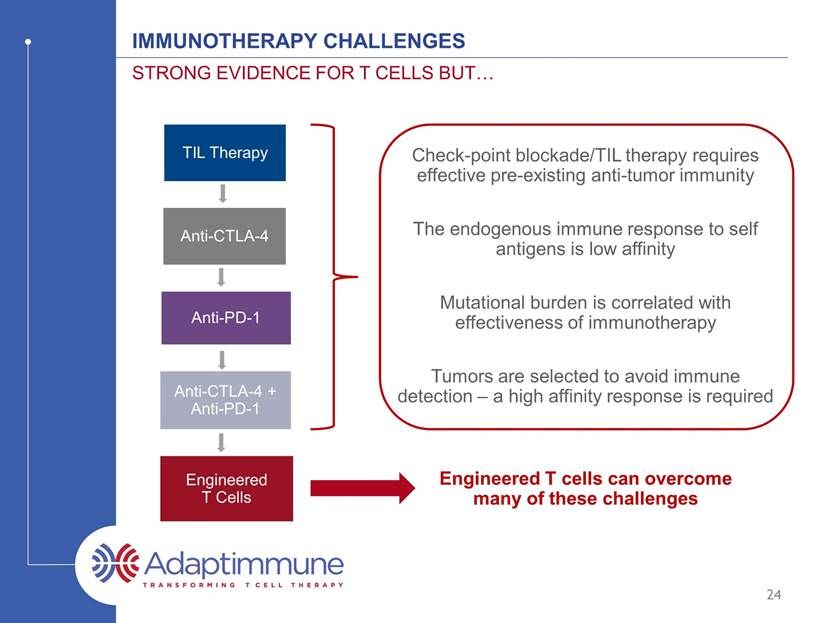
IMMUNOTHERAPY CHALLENGEs Strong evidence for t cells but 24 Engineered T cells can overcome many of these challenges TIL Therapy Anti-CTLA-4 Anti-PD-1 Anti-CTLA-4 + Anti-PD-1 Engineered T Cells Check-point blockade/TIL therapy requires effective pre-existing anti-tumor immunity Mutational burden is correlated with effectiveness of immunotherapy The endogenous immune response to self antigens is low affinity Tumors are selected to avoid immune detection – a high affinity response is required
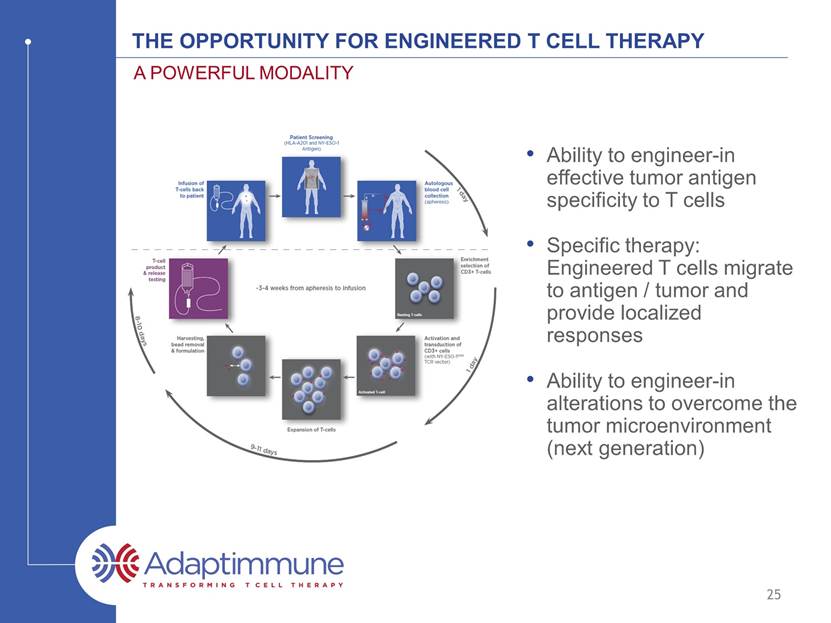
The opportunity for engineered t cell therapy A powerful modality 25 Ability to engineer-in effective tumor antigen specificity to T cells Ability to engineer-in alterations to overcome the tumor microenvironment (next generation) Specific therapy: Engineered T cells migrate to antigen / tumor and provide localized responses
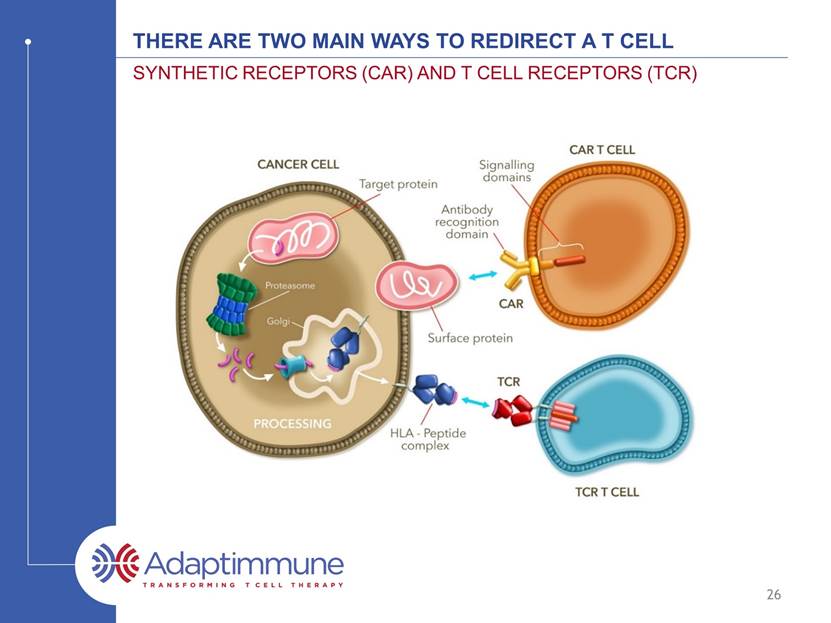
There ARE TWO MAIN WAYS TO REDIRECT A T CELL SYNTHETIC RECEPTORS (CAR) AND T CELL RECEPTORS (TCR) 26 *CAR – Chimeric Antigen Receptor, ALL – Acute Lymphoblastic leukemia, DLBCL – Diffuse Large B-Cell Lymphoma
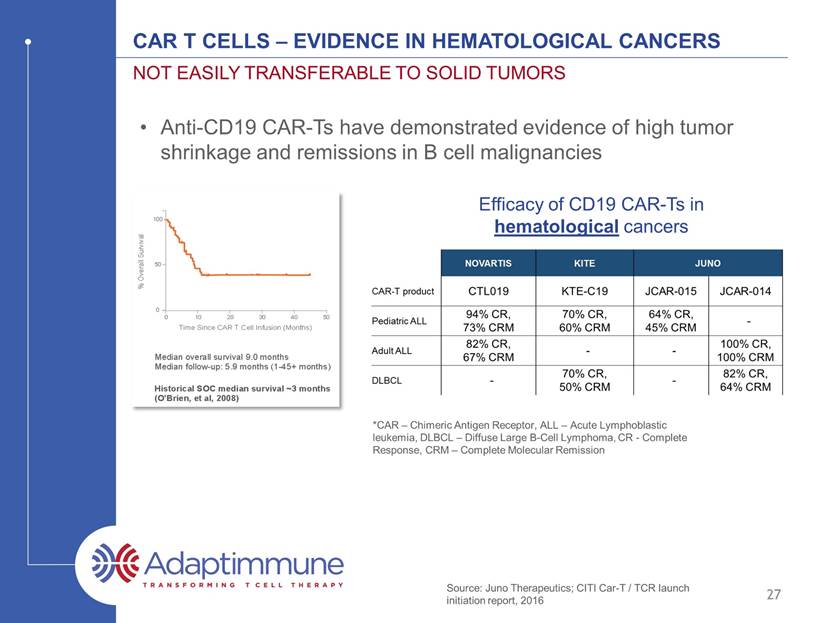
CAR T Cells – Evidence in hematological cancers Not easily transferable to solid tumors 27 Anti-CD19 CAR-Ts have demonstrated evidence of high tumor shrinkage and remissions in B cell malignancies *CAR – Chimeric Antigen Receptor, ALL – Acute Lymphoblastic leukemia, DLBCL – Diffuse Large B-Cell Lymphoma, CR - Complete Response, CRM – Complete Molecular remission Efficacy of CD19 CAR-Ts in hematological cancers Source: Juno Therapeutics; CITI Car-T / TCR launch initiation report, 2016
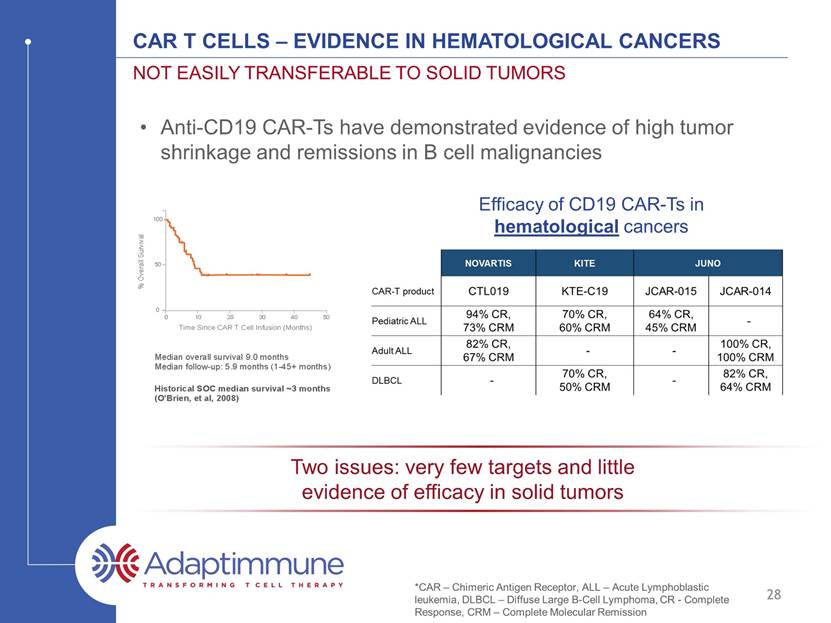
CAR T Cells – Evidence in hematological cancers Not easily transferable to solid tumors 28 Efficacy of CD19 CAR-Ts in hematological cancers Anti-CD19 CAR-Ts have demonstrated evidence of high tumor shrinkage and remissions in B cell malignancies Two issues: very few targets and little evidence of efficacy in solid tumors *CAR – Chimeric Antigen Receptor, ALL – Acute Lymphoblastic leukemia, DLBCL – Diffuse Large B-Cell Lymphoma, CR - Complete Response, CRM – Complete Molecular remission
Optimized affinity TCR T cells Address solid tumors and intracellular targets 29 Optimized affinity TCR T cells demonstrate efficacy in solid tumors Sources: SITC, November 2015
Optimized affinity TCR T cells Address solid tumors and intracellular targets 30 Optimized affinity TCR T cells demonstrate efficacy in solid tumors Vast majority of cancer targets are intracellular and ONLY engaged by T cells via TCRs
DEVELOPING EFFECTIVE affinity optimized TCR T CELLS high barriers to entry 31 Specialized data and expertise required to identify the correct peptide targets Challenging to identify TCRs Essential to optimize the affinity of the TCR Specialized expertise and assays required for establishing TCR specificity Manufacturing expertise for both cell and vector required Clinical expertise for safe administration and effective study design for cell therapy required
ADAPTIMMUNE SPEAR t cell PLATFORM uniquely overcomes these hurdles 32 SPEAR T CELLS Specific Peptide Enhanced Affinity Receptor Target Identification TCR Identification TCR Engineering – Optimized Affinity TCR Safety Testing Generation 2 T cells Generation 3 T cells
Adaptimmune investor and analyst day 2016 SPEAR T cells: Adaptimmune’s Proprietary Technology Platform April 22, 2016 Bent Jakobsen, Ph.D. Chief Scientific Officer and Co-founder, Immunocore Scientific Founder, Adaptimmune Therapeutics plc Fellow of The Academy of Medical Sciences
ADOPTIVE T CELL - Most powerful unit in Immunotherapy Four components to an effective adoptive therapy: T cell must recognize a cancer cell via a guiding receptor The guiding receptor has two important aspects Affinity Specificity Cancer cell Apoptosis T cell Armory Perforin Granzyme T cell 34 Cancer cell Affinity Specificity T cell 1. 2.
ADOPTIVE T CELL - Most powerful unit in Immunotherapy Four components to an effective adoptive therapy: T cell must recognize a cancer cell via a guiding receptor The guiding receptor must have two important aspects Affinity Specificity The T cell needs to be resistant to suppression T cell Cancer cell Inhibitory mechanisms of cancer cells make T cells insensitive Make T cells resistant to suppression 35
ADOPTIVE T CELL - Most powerful unit in Immunotherapy Four components to an effective adoptive therapy: T cell must recognize a cancer cell via a guiding receptor The guiding receptor must have two important aspects Affinity Specificity The T cell needs to be resistant to suppression The T cell (either alone or via other mechanisms) needs to ‘break cancer immune tolerance’ T cell Cancer cell Make T cells resistant to suppression Epitope spreading Epitope spreading 1 2 3 4 36
37 Affinity & specificity

ADOPTIVE T CELL - Most powerful unit in Immunotherapy Four components to an effective adoptive therapy: T cell must recognize a cancer cell via a guiding receptor The guiding receptor has two important aspects Affinity Specificity Cancer cell Affinity Specificity T cell 38
TCR Affinity - Determined by Thymic selection The entire peptidome (all peptides) is presented in the thymus T cells undergo positive and negative selection within the cortex and medulla of the thymus High affinity Low affinity Negative selection Positive selection Thymus 39 x
Natural T cells are ill-equipped to clear cancer Due to negative selection virtually all circulating T cells that have self peptide specificity will have low affinity TCRs This mechanism guards the body against autoimmunity However all reasonably prevalent peptide antigens of cancer relevance are of self origin Many of these peptide antigens are derived from proteins for which the encoding gene is silenced (or severely suppressed) in all (or almost all) adult tissues 40
Viral TCRs have higher affinity than natural cancer TCRs Aleksic, M. et al. (2012). Eur J Immunol 10.1002/eji.201242606 Strong Weak Antigen recognition Virus TCRs Naturally-occurring Cancer TCRs MAGE-A4 KD ~ 64 mM MAGE-A10 KD ~ 2 mM Not a natural TCR Identified from proprietary TCR display libraries 41
Affinity optimizing cancer TCRs is pivotal to t cell function Some non-engineered TCRs will recognise antigen well e.g. NY-ESO Even so, engineering improves antigen recognition Some non-engineered TCRs fail to recognise antigen well e.g. MAGE-A4 Engineering enables antigen recognition Affinity engineering is a critical step in TCR optimization 42
NY-ESO: natural Versus engineered TCR functionality IM-9 SKMel137 HEP2 N2 NY-ESO+ NY-ESO_ NY-ESO engineered NY-ESO wt IFNg Spot Numbers GrB Spot Numbers IM-9 SKMel137 HEP2 HA2 NY-ESO+ NY-ESO_ 43 Even for NY-ESO affinity engineering improves T cell function
NY-ESO: natural Versus engineered TCR functionality IM-9 (NY-ESO+) N9 (NY-ESO-) NY-ESO wt NY-ESO Engineered 44 Even for NY-ESO affinity engineering improves cancer killing % cytotoxicity % cytotoxicity E:T ratio E:T ratio E:T ratio -10 0 10 20 30 40 50 60 70 0.625 1.25 2.5 5 -10 0 10 20 30 40 50 60 70 0.625 1.25 2.5 5
MAGE-A4: effect of optimizing tcr affinity 45 TCR Affinity (mM) HCT116 Human colon carcinoma U266 Human myeloma IM9 EBV-transformed B cell A375 Human melanoma SKMel28 Human melanoma Mel624 Human melanoma ntd 208 144 64 40 25 24 7 3 1 ntd 208 144 64 40 25 24 7 3 1 ntd 208 144 64 40 25 24 7 3 1 ntd 208 144 64 40 25 24 7 3 1 ntd 208 144 64 40 25 24 7 3 1 ntd 208 144 64 40 25 24 7 3 1 WT WT WT WT WT WT
Affinity optimizing cancer TCRs is pivotal to t cell function Some non-engineered TCRs will recognise antigen well e.g. NY-ESO Even so, cancer cell killing is dramatically improved by affinity optimization Some non-engineered TCRs fail to recognise antigen well e.g. MAGE-A4 The optimal affinity is crucial for T cell function and the same across all cancer cell lines Affinity engineering is a critical step in TCR optimization 46
47 Specificity & Toxicity
Specificity and non-specificity Off target (specific) Off target (non-specific) alloreactivity Closely related antigen on normal tissue Alternate HLA restriction Target antigen on normal tissue normal tissue On target 48 Promiscuous recognition (unrelated to target)
Target antigen on normal tissue Specificity: target expression On target Optimized target selection process Select targets expressed on cancer cell Low expression (due to HLA downregulation) overcome by high affinity TCRs No / extremely low expression in normal tissue* normal tissue *Expression tolerable in some normal tissues (e.g. prostate, breast, pancreas, immuno- privileged tissues) 49
MAGE-A4 - Expression in Cancer Cancer Type Normalized Expression MAGE-A4 expression from cancer genome atlas (TCGA) lung cervical bladder head & neck breast ovarian melanoma stomach 50
MAGE-A4 - Expression in normal tissue Tissue Type RNAseq Log scale RNAseq (Log scale) GTEx Portal 51 Expression is absent / low in most adult non-reproductive tissues
MAGE-A10 - Expression in Cancer Normalized Expression MAGE-A10 expression from cancer genome atlas (TCGA) 52 lung SgCC bladder head & neck breast ovarian melanoma lung Cancer Type
MAGE-A10 - Expression in normal tissue RNAseq (Log scale) GTEx Portal RNAseq Log scale Tissue Type 53 Expression is absent / low in most adult non-reproductive tissues testis
Specificity and non-specificity Off target (specific) Closely related antigen on normal tissue 54 Potential for off-target specificity can be analyzed because the antigen is short and linear X-Scan Identify potential targets via genome search Test recognition by high affinity TCR
X-SCAN: individual peptide position Specificity Testing T A R G E T H E R E A A R G E T H E R E C A R G E T H E R E D A R G E T H E R E E A R G E T H E R E F A R G E T H E R E G A R G E T H E R E H A R G E T H E R E I A R G E T H E R E K A R G E T H E R E L A R G E T H E R E M A R G E T H E R E N A R G E T H E R E P A R G E T H E R E Q A R G E T H E R E R A R G E T H E R E S A R G E T H E R E V A R G E T H E R E W A R G E T H E R E Y A R G E T H E R E T A R G E T H E R E A I K - - M - - E D C L H K G D V N K E S Q F S G Y H I K L M N P Q R S V W Y TCR ‘tolerance’ motif Search Human Genome for all possible peptide matches and investigate these via: TCR recognition Peptide presentation Essential to determine which amino acids are critical This is achieved by Single Amino Acid Substitution Mapping (X-scan) 55
MAGE-A10 - TCR GENERATION AND SELECTION Three TCRs selected by specificity testing from an original pool of 21 parentals Affinity enhancement leads to 15 variants plus 3 parents and 1 reverted heavy chain parental for testing Cell based potency and specificity testing to select five candidates from 2 parents Additional efficacy testing resulted in two comparable leads for X scan evaluation clone 796 clone 756 non-specific * * * Point mutation in heavy chain (corrected at level 2) 56
MAGE-A10 TCR: ‘X-scan’ Specificity Analysis TCR peptide recognition mapping using combinatorial amino acid substitutions POSITION 1 2 3 4 5 6 7 8 9 G L Y D G M E H L X L Y D G M E H L G X Y D G M E H L G L X D G M E H L G L Y X G M E H L G L Y D X M E H L G L Y D G X E H L G L Y D G M X H L G L Y D G M E X L G L Y D G M E H X TOLERANCE MOTIF X ACFGILMNQSTV FWY ACDY AGLPST MP EQ CHLMQR ACFILMTV Position 7 substitution Position 9 substitution Position 8 substitution Position 4 substitution Position 6 substitution Position 5 substitution Position 1 substitution Position 3 substitution Position 2 substitution 57 R e l a t i v e r e s p o n s e A C D E F G H I K L M N P Q R S T V W Y A C D E F G H I K L M N P Q R S T V W Y A C D E F G H I K L M N P Q R S T V W Y 0.0 0.5 1.0 1.5 p1 p2 p3 * * R e l a t i v e r e s p o n s e A C D E F G H I K L M N P Q R S T V W Y A C D E F G H I K L M N P Q R S T V W Y A C D E F G H I K L M N P Q R S T V W Y 0.0 0.5 1.0 1.5 p4 p5 p6 * * R e l a t i v e r e s p o n s e A C D E F G H I K L M N P Q R S T V W Y A C D E F G H I K L M N P Q R S T V W Y A C D E F G H I K L M N P Q R S T V W Y 0.0 0.5 1.0 1.5 p7 p8 p9 * * *
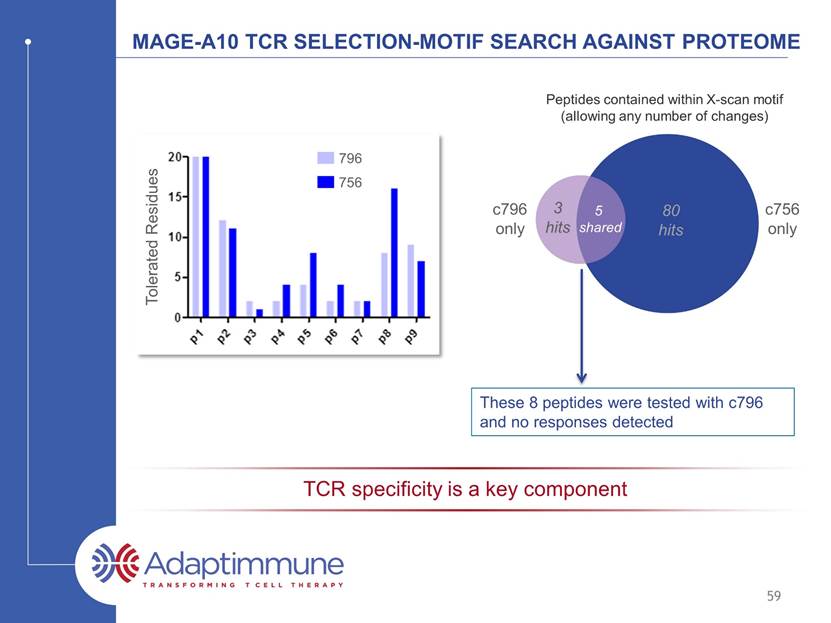
MAGE-A10 TCR: ‘X-scan’ Specificity Analysis TCR peptide recognition mapping using combinatorial amino acid substitutions G T Y D G M E L L A Q F C A P Q I V R V D N L G F M T K L E M I L G H I C S I A T A I G M Q A K Q P V K A F E C L S S D M P C T M M F H H N V Q P I V H C I P C A W G A K E K T F S M N T P F N V S W L F W G M S S T D H Y C L Q C R Y K S H H E D E A N R I D S I W T C R H F E N V K W H Q N D P P W R F L D E N K Q Y N R W K G Y W G R V Y Y E P V R R T Y Q D W Y >50% >30% >20% >15% >10% NR Tolerated residues at each position cutoff: >10% of native MAGE-A10 peptide response [INDEX PEPTIDE] M 58 [SLLMWITQC](M) Spot count 10 -12 10 -11 10 -10 10 -9 10 -8 10 -7 10 -6 0 50 100 150 200 EC 90 10% cut-off
MAGE-A10 TCR SELECTION-MOTIF SEARCH AGAINST PROTEOME 80 hits 5 shared c796 only These 8 peptides were tested with 796 and no responses detected 59 TCR specificity is a key component Tolerated Residues 756 796 3 hits c756 only Peptides contained within X-scan motif (allowing any number of changes)
Specificity and non-specificity Off target (non-specific) Promiscuous recognition (unrelated to target) 60 Potential for off-target non-specific reactions are tested by examining the ability of high-affinity TCRs to react to a panel of normal cell-lines
MAGE-A10 TCR - Screening against normal primary cells MAGE-A10c796T was evaluated in IFN- ELISpot assays against 59 normal primary cells expressing HLA-A2 No increase above background levels with transduced T cells 61 + con n o t a r g e t I M 9 H C P E p i C 3 H C P F 1 H A 1 3 H A 2 H A 5 H M E p i C 2 _ A 2 H M E p i C 3 _ A 2 H M F 1 _ A 2 C M 5 d i f f C M 5 d i f f C M 7 C M 1 2 d i f f C M 1 2 C M 1 3 C M 1 4 C M 1 8 H R C E p 1 H R C E p 5 H R G E C 1 H R G E C 2 R E N 2 R E N 5 H E P 2 H E P 3 H E P 5 H P A S M C 1 H P M E C 2 P F 4 P F 5 H S k M M 2 H S k M M 2 d i f f H S k M M 3 H S k M M 3 d i f f H S k M M 5 H S k M M 5 d i f f S k M C 3 H D F 1 0 H D F 2 H D F 5 N 1 N 9 N H E K 3 N H E K 4 S M C 3 G S M C 1 H V M F 1 H A o 1 5 H A o 1 6 H A o A F 2 H A o A F 4 H C A E C 2 H C A E C 6 H C A E C 7 H C A S M C 7 H D M E C 2 H D M E C 6 H D M E C 7 H O F 2 H O M E C 1 0 100 200 300 I F N g s p o t n u m b e r no T cells ntd T cells (n=3) MAGE-A10 796 T cells (n=3) breast heart kidney liver brain lung skeletal muscle skin intestinal vasculature ovary
Specificity and non-specificity alloreactivity Alternate HLA restriction 62 Potential for alloreactivity are tested by examining the ability of high-affinity TCRs to react to a panel of normal cell-lines with alternate HLA restrictions
MAGE A10 TCR: Alloreactivity assay Panel of EBV-transformed B cells expressing a range of HLA types 67 cell lines expressing a total of 131 different HLA alleles Responses observed in cells expressing HLA-B*1501 and HLA-B*4601 B*1501 B*4601 con MAGE-A10 TCR T cells non-transduced control T cells 63 HLA-B*1501 and HLA-B*4601 become exclusion criteria for clinical trial
64 tcrs with Supra-natural specificity
Tcr from display library has supra-natural affinity Aleksic, M. et al. (2012). Eur J Immunol 10.1002/eji.201242606 Strong Weak Antigen recognition Virus TCRs Naturally-occurring Cancer TCRs 65 MAGE-A10 KD ~ 2 mM Not a natural TCR Identified from proprietary TCR display libraries
Natural tcrs typically can recognize one million different peptides Thymic selection narrows TCR specificity / cross-reactivity spectrum TCR has to recognize approximately 1,000,000 peptides to be positively selected 103 104 105 106 107 108 109 Number of peptides recognized by a TCR Number of TCRs 66 Natural repertoire
tcrs selected from phage libraries can have supra-natural specificity Thymic selection narrows TCR specificity / cross-reactivity spectrum TCR has to recognize approximately 1,000,000 peptides to be positively selected 103 104 105 106 107 108 109 Number of peptides recognized by a TCR Number of TCRs 67 Natural repertoire Supra-natural TCRs e.g. MAGE-A10 TCR
68 Finding the right Targets

The spectrum of potential cancer targets for immunotherapy see http://cancerimmunity.org/peptide/ for a list of tumor antigens reported in the literature Cancer testis antigens expression restricted to immune-privileged tissue e.g. MAGE family / NY-ESO Differentiation antigens tissue restricted expression e.g. Tyrosinase / gp100 Overexpressed antigens overexpressed in tumour cells e.g. WT1 / telomerase Tumour specific antigens not expressed in normal tissues Viral antigens e.g. EBV/HPV Mutated antigens e.g p53 Neo-antigens Ideal Good Depends on tissue Depends on extent of normal tissue expression Ubiquitous antigens expressed in all cells e.g. Her2/neu Unlikely to be suitable 69 Tumor selectivity Prevalence
Peptide target Validation via mass spectrometry Many identified target peptides fail to be presented in vivo Not found by Adaptimmune mass spectrometry Not detected by potent TCRs / T cells Adaptimmune ONLY considers peptides to be validated if detected by mass spectrometry Currently ~ 660,000 unique peptides within our databases 70 PSCA 14-22 (ALQPGTALL) WT1 126-134 (RMFPNAPYL) Telomerase 540-548 (ILAKFLHWL)
recently filed patents on 63 targets 873 peptides Targets / cancer indication 71 0 5 10 15 20 Melanoma AML/B cell malignancies Head and Neck Kidney Ovarian Oesophageal/Gastric Bladder Liver Prostate Pancreas Breast Colon Lung SC Lung Ad Lung Sq
72 Generation 2: making T cells resistant to suppression
ADOPTIVE T CELL : generation 2 Four components to an effective adoptive therapy: T cell must recognize a cancer cell via a guiding receptor The guiding receptor must have two important aspects Affinity Specificity The T cell needs to be resistant to suppression T cell Cancer cell Inhibitory mechanisms of cancer cells make T cells insensitive Make T cells resistant to suppression 73
Overcoming inhibition in the tumour microenvironment Gen2(A) makes T cells insensitive to inhibitory factor x ntd GEN1 TCR GEN2 TCR targets alone INHIBITORY FACTOR X - + - + TARGET 1 TARGET 2 150 100 50 IFNg (pg / mm) 0 74 0 100 200 300 400 I F N - g ( p g / m l ) targets alone ntd TCR Gen2(A)_TCR no target - + - + - + inhibitor X target 1 target 2
Overcoming inhibition in the tumour microenvironment Gen2(A) makes T cells insensitive to inhibitory factor x ntd GEN1 TCR GEN2 TCR targets alone INHIBITORY FACTOR X - + - + TARGET 1 TARGET 2 150 100 50 IL-2 (pg / mm) 0 75 0 50 100 150 I L - 2 ( p g / m l ) targets alone ntd TCR Gen2(A)_TCR inhibitor X no target target 1 target 2 - - - + + +
TCR + FACTOR X TCR alone Gen2(A) TCR maintains enhanced killing in the presence of inhibitors Target cells / mm2 GEN2 TCR alone GEN2 TCR + FACTOR X Overcoming inhibition in the tumour microenvironment Gen2(A) makes T cells insensitive to inhibitory factor x Time (h) 76 0 10 20 30 40 0 200 400 600 800 1000 Time (h) T a r g e t c e l l s / m m 2 TCR + inhibitor X TCR
Overcoming inhibition in the tumour microenvironment Gen2(C) makes T cells insensitive to inhibitory factors Y & Z GEN1 TCR GEN2 TCR 77
Overcoming inhibition in the tumour microenvironment (II) Gen2(C) makes T cells insensitive to inhibitory factors Y & Z Gen2(C) TCR maintains enhanced killing in the presence of inhibitors Target cells / mm2 TCR + inhibitor TCR alone GEN2 TCR ± inhibitor Time (h) 78
79 Generation 3: enabling T cells to help ‘break cancer immune tolerance

ADOPTIVE T CELL : generation 3 Four components to an effective adoptive therapy: T cell must recognize a cancer cell via a guiding receptor The guiding receptor must have two important aspects Affinity Specificity The T cell needs to be resistant to suppression The T cell (either alone or via other mechanisms) needs to ‘break cancer immune tolerance’ T cell Cancer cell Epitope spreading Epitope spreading 80
Broadening the immune response Gen3(B) enhances cd40L expression to promote epitope spreading CD40L expression Gen2(B) enhances TCR mediated CD40L upregulation on CD4+ T cells in response to antigen positive targets Normalised events ntd T cells (MFI= 118) T cells + TCR (MFI= 116) T cells + TCR + Gen3(B) (MFI= 313) 81
Generation 2 and generation 3 T cells Several Generation 2 projects that help T cells overcome sensitivity to inhibitory factors in the tumor microenvironment Several Generation 3 projects that enable T cells to promote epitope spreading and therefore have the potential to aid the breaking of tumor immune tolerance First Generation 2 / 3 IND anticipated in 2017 82
Adaptimmune t cell technology TCR affinity optimization crucial for best T cell response to cancer Specificity crucial for lowest toxicity – supra-naturally specific TCRs identified from proprietary display libraries Several Generation 2 technologies making T cells resistant to tumour microenvironment inhibitory factors Several Generation 3 technologies enabling T cells to facilitate breaking immune tolerance to tumor 83 summary
Adaptimmune investor and analyst day 2016 Adoptive T cell Therapy: Clinical Activity of NY-ESO-1 in a Solid Tumor April 22, 2016 Stephan Grupp, M.D., Ph. D. Novotny Professor of Pediatrics University of Pennsylvania Perelman School of Medicine
93% CR rate for relapsed/refractory ALL after CTL019 59 r/r pediatric ALL pts: 55 in CR at one mo (93%) median f/u 12 mo Six went to subsequent transplant, one to DLI Six mo RFS: 76% (95%CI:0.65,0.89) 12 mo RFS: 55% (95%CI: 0.42,0.73) No relapses past one year 18 patients in remission beyond one year, 13 without further therapy 85
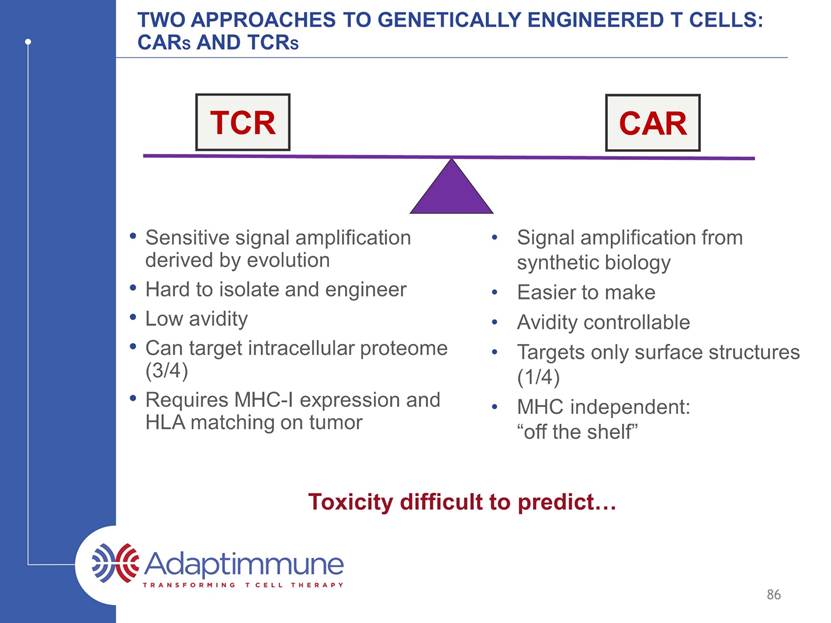
Two approaches to genetically engineered T cells: CARs and TCRs 86 Sensitive signal amplification derived by evolution Hard to isolate and engineer Low avidity Can targets intracellular proteome (3/4) Requires MHC-I expression and HLA matching on tumor Signal amplification from synthetic biology Easier to make Avidity controllable Targets only surface structures (1/4) MHC independent: “off the shelf” Toxicity difficult to predict TCR CAR
Ny-eso-1 76% of synovial sarcomas express strong staining, defined as 2-3+ in >50-70% (Lai, Mod Pathol 2012) A TCR recognizing NY-ESO-1 in the context of HLA:A0201 was cloned from a patient with cancer, then modified for higher affinity (Zhao, J Immunol, 2007) A Cancer-testis antigen highly expressed in synovial sarcoma NY-ESO IHC screening on Synovial Sarcomas 87
Two CLINICAL TRIALS OF Adaptimmune’s NY-ESO-1 TCR in Synovial Sarcoma Investigator Initiated Trial: The Surgical Branch of the NCI did a study of Adaptimmune’s NY-ESO-1-transduced lymphocytes in synovial sarcoma (Cy/Flu + HD IL-2) Partial response in 4 of 6 synovial sarcomas (Robbins et al, JCO 2011) Follow-up report: Objective responses in 11 of 18 synovial cell sarcomas (61%) (Robbins, Clin Can Res 2015) Estimated 3-year OS: 38%; 5-yr OS 14% 88 Adaptimmune Trial: Included changes to improve safety and treatment feasibility Determine response rate without HD IL-2 Use of lentiviral vector Central manufacturing site (GMP) and cryopreserved final product Recent new cohort with cyclophosphamide alone (no fludarabine) Recent additional cohort of NY-ESO-1 low expressors (<2+ in 50%)
Adaptimmune’s NY-Eso-1 sarcoma trial schema -3 -4 -2 -1 0 d+2 +4 +7 +10 -5 d-6 Cyclophosphamide 1800mg/m2 IV (+ mesna) Fludarabine 30mg/m2 IV Daily until ANC>1000 Filgrastim 5ucg/kg SQ daily Enrollment Apheresis Manufacturing No IL-2 * 1 x 109/kg (min 1 x 10⁷/kg; max 40x109 total) Supportive care: Infection prophylaxis, observation for CRS, GvHD, f/u safety and efficacy 89 T cell infusion: (Mean=5x10⁹ cells*)
Ny-eso-1 sarcoma study: Cohort 1 Patient NY-ESO Staining (archival tissue) Total Transduced T cells (x109) NY-ESO TCR+ T cells / kg (x106) Best Overall Response 200 2-3+ in >50% 14.4 91.3 SD 201 3+ in 100% 8.3 165.01 CR 202* 3+ in 30% 6.6 69.99 PR 204 2-3+ in 50% 3.8 60.32 PR 205 3+ in ~100% 3.4 62.50 PR 261 3+ >99% 0.72 9.11 SD 206 2+ >50% 0.45 5.51 SD 207 3+ >80% 2.67 25.36 SD 208 3+ >95% 4.84 47.97 PR 209 3+ in ~100% 2.51 27.9 PR 263 3+ >50% 2.51 45.39 PD 230 2-3+ in 100% 7.86 143 PD Mean 4.17 57.4 60% objective response rate in patients treated at target dose 90 *Treated in cohort 1 under a protocol exception
Synovial sarcoma overall survival cohort 1 91 5/12 patients alive 4/2016 1 year survival: 75% 2 year survival: 25% Source: Adaptimmune April 2016 cutoff Median survival: 56 weeks (95% CI: 37, 159)
Synovial Sarcoma Study: All cohorts Incidence (n,%) of SAEs (>1 occurrence) 92 January 2016 cutoff Preferred Term Number of Subjects by Maximum Grade (N=16) All SAEs Related* Fatal Pyrexia 4 (25) 2 (12.5) 0 Cytokine release syndrome 2 (12.5) 2 (12.5) 0 Lymphopenia/Lymphocyte count decreased 2 (12.5) 2 (12.5) 0 Neutropenia 2 (12.5) 2 (12.5) 0 Febrile neutropenia 2 (12.5) 1 (6.3) 0 Thrombocytopenia 2 (12.5) 2 (12.5) 0 Dyspnea 2 (12.5) 1 (6.3) 0 Source: Adaptimmune
PHASE I/II STUDY IN SYNOVIAL SARCOMA Radiographic pseudoprogression and response of lung metastases leading to complete response Baseline: Bilateral miliary metastatic disease C-Reactive Protein Day +2: Pseudoprogression due to immune infiltration Day +101: Complete Response Source: AACR April 2015 93
Clinical response followed by Resection at Progression Mass began to show regrowth ~6 months Surgically resected at 7 months No NY-ESO-1 TCR cells found in tumor Substantial CD4+ T cells 1/22/14 3/3/14 4/7/14 94 No evidence of disease 27 months post NY-ESO-1 T cell infusion; 20 months from surgical resection of metastasis
Near complete response to NY-ESO-1 T Cells of Unresectable Primary Tumor in the knee Complete surgical resection accomplished, no irradiation Local disease remained controlled; patient developed lung metastasis with loss of NY-ESO-1 2 months post NY-ESO TCR T cells 95 Baseline Source: SITC, November 2015
Tumor Shrinkage Over the Course of Several Months Following NY-ESO-1 TCR for Synovial Sarcoma Multiply Recurrent, Unresectable Pulmonary Masses 96 Ongoing PR 400+ days post T cell infusion 2 months Baseline 12 months Source: Adaptimmune
T cells traffic to the site of tumor At resection Remaining tumor was NY-ESO negative 97 NY-ESO expression CD8 Expression Source: Adaptimmune
Clinical responses observed across a spectrum of ny-eso-1 expression 98 Baseline 11-05-13 Month 3 02-18-14 Response in a patient with Low NY-ESO-1 expression Source: Adaptimmune

Clinical responses observed across a spectrum of ny-eso-1 expression 99 Baseline Month 6 Response in a patient with Very High NY-ESO-1 expression Source: Adaptimmune
Ny-eso-1 sarcoma study Durable persistence of NY-ESO-t Days post infusion Days post infusion Vector Copies / µg genomic DNA Subjects receiving minimum evaluable dose (>1x10⁹ NY-ESO-1c259T cells) Time of progression LOD LOD Among evaluable subjects, higher peak persistence was observed among responders compared to non responders To date, among responders, NYESO-1 T cells have been detected up to 21 months. 100 Source: November SITC, 2015 10 100 1000 10000 100000 1000000 0 10 19 26 56 90 127 176 265 363 Non - responders 200 207 230 263 10 100 1000 10000 100000 1000000 0 9 16 23 42 59 91 127 162 189 278 540 Responders 201 202 204 205 208 209
Ny-eso-1 sarcoma study Remarkable Persistence of NY-ESO TCR+ T Cells in Sarcoma Patient Experiencing a Complete Response 3M D28 D60 D0 4M 5M 9M 12M 6M 14.6% 13.1% 12.1% 12.5% 12.8% 11.7% 10.4% 11.3% 0.07% NYESO1 Dex CD8 Relapse with NY-ESO+ Disease 101
Clinical Summary NY-ESO-1 TCR T cells has manageable toxicity Fever, low grade cytokine release common in the week following cell infusion Anti-tumor activity confirmed in the absence of HD IL-2: 60% response without HD IL-2 Pseudo-progression, gradual reductions in tumor burden and NY-ESO TCR+ T cells in resected tumor indicate immunologic basis for response NY-ESO-1 TCR T cells are highly persistent Longest persistence observed with a TCR to date Mechanisms of resistance: Elucidating mechanisms of immune escape through analysis of pre- and post-treatment tissue 102
Adaptimmune investor and analyst day 2016 NY-ESO-1 T cell Therapy in Multiple Myeloma: Long Term Efficacy and Persistence April 22, 2016 Aaron P. Rapoport, MD Professor of Medicine Gary Jobson Professor in Medical Oncology University of Maryland Marlene and Stewart Greenebaum Cancer Center

Multiple myeloma The American Cancer Society estimates that in 2016* ~30,330 new cases will be diagnosed ~12,650 deaths will occur 1/143 lifetime risk Slightly more common in men than women Incidence in African-Americans about twice that in Caucasians Mean age is approximately 60 years Model Blood Cancer 104 *https://cancerstatisticscenter.cancer.org/?_ga=1.104040064.1641643651.1460834859#/cancer-site/Myeloma
Advantages of cellular immunotherapy Kills “resistant” tumors (e.g. 17p – P53 del) Penetrates “sanctuary” sites (e.g. CNS) Through expansion and serial killing can eradicate “large” tumors Can generate long-lived “memory” responses to protect against recurrence High degree of specificity, avoids second malignancies and immunodepletion 105
Why target Cancer Testis Antigens in MM Advanced MM frequently expresses the Cancer Testis antigens NY-ESO-1 or LAGE-1 Expression of Cancer Testis antigens is associated with poor prognosis in myeloma1 Adaptimmune’s NY-ESO-1 TCR was tested in multiple myeloma Same epitope present on both antigens2 106 1. Dhodapkar et al, Cancer Immun, 2003 Atanackovic et al, Clin Cancer Res, 2009; and others 2. Li et al, Nat Bio, 2005; Robbins et al, JCO 2011 and CCR 2014
Phase I/II study in Multiple myeloma All enrolled patients (n=25): Symptomatic myeloma with active disease High risk population Average of 3 prior Rx; range 1-5 7 patients had prior autologous stem cell transplant (ASCT) Twelve with cytogenetic abnormalities (7 categorized as high-risk) Conditioned with high-dose melphalan followed 2 days later by ASCT -2 0 +2 Stem cells High dose melphalan Response assessments (marrow / myeloma markers) NY-ESO T Cells (1-10 billion total cells) 42 100 180 270 Enrollment Apheresis 107
Medically eligible for transplant High risk or relapsed disease ECOG performance status: Grade 0-2 HLA-0201 Myeloma cells express NY-ESO-1 and/or LAGE-1 by RT-PCR Phase I/II study in Multiple myeloma Study patient population 108 Study endpoints Safety and Tolerability Secondary: Clinical Responses Proof of Mechanism International Uniform Response Criteria Additional category of nCR: -ve M spike but +ve by immunofixation RESPONSE ASSESSMENTS
Phase I/II study in Multiple myeloma Best Response by day 100 Number of Patients % Total CR 3 14% nCR 10 45% VGPR 2 9% PR 5 23% SD 1 5% PD 1 5% Not assessable* 3 NA Total evaluable 22 100% Response assessment * Patients with VGPR or better going into transplant Rapoport et al. Nat Med 21(8):914-21 109 RR= 91% CR+nCR+VGPR = 68%
Phase I/II study in Multiple myeloma Duration of response Days on Study 110 265 264 263 262 261 260 259 212 258 257 256 211 210 209 255 202 207 254 204 253 252 201 200 206 250 * * * * * * * * * * * * † † † † † † † † † 0 200 400 600 800 1000 1200 1400 * * Patient Number nCR/CR/sCR VGPR PR SD PD Deceased Revlimid day 100 High risk karyotype Prior transplant Days post infusion Progression † * * Cut-off date: March 2015 Overall survival as of January 2016: Median OS ~3 years (Cut-off date: January 2016) Progression free survival (PFS) as of November 2015 Median PFS = 19.1 months (Cut-off date: November 2015) Rapoport et al. Nat Med 21(8):914-21
Multiple Myeloma overall survival median survival: ~3 years (range: 28 weeks to 4.25+ years) 111 Source: Adaptimmune January 2016 Cutoff Median Survival: 3 years
Phase I/II study in Multiple myeloma NY-ESO-1 T cells Traffic to Sites of Tumor (bone Marrow) CD8 T cells CD3 Myeloma cells (CD138) Day 7 Day 7 NY-ESO-1 Control 0.0 11.2 112
Phase I/II study in Multiple myeloma Resolution of Disease in Bone Marrow and Plasmacytoma by Day 56 Post-therapy with NY-ESO-1 TCR transduced t cells 113 Pre-treatment Day 56
Phase I/II study in Multiple myeloma Massive infiltration of T Cells into marrow correlate with response following second infusion Pre-infusion Day 24 Day 38 CD8 T cells Myeloma cells (CD138) 114
Phase I/II Study in Multiple Myeloma Antigen Spreading: Clonal expansion of two TCR clonotypes Day 68 post infusion Day 28 post infusion Patient 253 115
Phase I/II study in Multiple myeloma Incidence (n,%) of All SAEs (>1 occurrence) 116 Preferred Term Number of Subjects by Maximum Grade (N=25)* All SAEs** Related Fatal Neutropenia 4 (16.0) 2 (8.0) 0 Pyrexia 3 (12.0) 1 (4.0) 0 Atrial fibrillation 3 (12.0) 0 (0.0) 0 Graft versus host disease 2 (8.0) 2 (8.0) 0 Diarrhoea 2 (8.0) 2 (8.0) 0 Hypoxia 2 (8.0) 1 (4.0) 0 Staphylococcal infection 2 (8.0) 0 (0.0) 0 *No episodes of CRS SAEs were reported **Includes all events reported as of 27Jan2016 excluding disease progression and laboratory abnormalities with the investigations and nutritional disorders SOCs except for combined haematologic terms above
Phase I/II Study in Multiple Myeloma NY-ESO-1 T cell persistence in peripheral blood 117 Blood persistence Marrow (site of tumor) persistence 100% 10% 1% 0.1% In further follow up, NY-ESO-1 T cells are detected beyond three years in peripheral blood
Phase I/II Study in Multiple Myeloma Continued Expression of NY-ESO-1 TCR in Blood and at Site of Tumor: day 360 1.3 1.2 Marrow 1.2 1.5 Patient 1 Patient 2 Blood 118
Phase I/II Study in Multiple Myeloma Persistence and relapse correlation At the time of relapse, blood and tumor were evaluated for NY-ESO-1 persistence and antigen, respectively Relapse corresponds to loss of persistence or loss of antigen Patient ID Timepoint at relapse Best response Persistence of NY-ESO T at relapse Antigen expression on tumor at relapse? 250 1 year sCR Y N 200 1 year nCR Y N 252 2.75 year PR N Y 253 4 months nCR N Y 204 6 months nCR N Y 254 6 months PR Y N 255 1.75 years nCR N Y 209 8 months nCR N Y 257 4 months nCR N Y 258 9 months nCR N Y 259 9 months sCR N Y 261 3 months PR N Y 262 5 months PR N Y 263 9 months PR N Y 119
PD-L1 expression upregulated in Myeloma Cells at Progression Planned Combination Study NY-ESO-1 T cells + PD-1 inhibitor Patients with Relapsed/refractory myeloma Cyclophosphamide/Fludarabine conditioning Randomization 1:1 NY-ESO-1 NY-ESO-1 + anti-PD1 Day 0 Day 420 % % 120 Planned Study
Summary Infusion of autologous T cells engineered with Adaptimmune’s affinity enhanced TCR specific for NY-ESO-1 and LAGE-1 antigens is well tolerated The duration of response is better than would be expected with transplant alone Toxicity related to cytokine release syndrome has not been observed Prolonged persistence (without IL-2) and trafficking of cells to bone marrow were detected Initial data suggest infused cells remain functional, without exhaustion, and include a diversity of phenotypes Upregulation of PDL-1 in relapsed patients supports combination studies 121
Rafael Amado, M.D. Chief Medical Officer Adaptimmune Investor and analyst day 2016 Update on Progress with NY-ESO TCR April 22, 2016
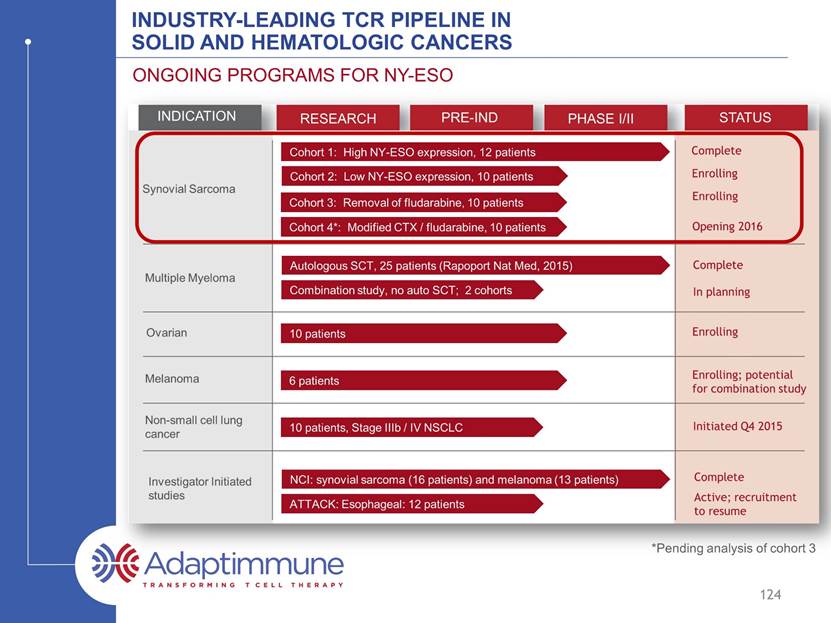
INDUSTRY-LEADING TCR PIPELINE IN SOLID AND HEMATOLOGIC CANCERS ONGOING PROGRAMS FOR NY-ESO INDICATION RESEARCH PRE-IND PHASE I/II STATUS Synovial Sarcoma Multiple Myeloma Ovarian Melanoma Non-small cell lung cancer Investigator Initiated studies Cohort 1: High NY-ESO expression, 12 patients Cohort 2: Low NY-ESO expression, 10 patients Cohort 3: Removal of fludarabine, 10 patients Cohort 4*: Modified CTX / fludarabine, 10 patients 10 patients 6 patients 10 patients, Stage IIIb / IV NSCLC ATTACK: Esophageal: 12 patients Combination study, no auto SCT; 2 cohorts Autologous SCT, 25 patients (Rapoport Nat Med, 2015) NCI: synovial sarcoma (16 patients) and melanoma (13 patients) Complete Enrolling Enrolling Enrolling Enrolling; potential for combination study Complete Complete In planning Initiated Q4 2015 Active; recruitment to resume 123 Opening 2016 *Pending analysis of cohort 3
INDUSTRY-LEADING TCR PIPELINE IN SOLID AND HEMATOLOGIC CANCERS ONGOING PROGRAMS FOR NY-ESO INDICATION RESEARCH PRE-IND PHASE I/II STATUS Synovial Sarcoma Multiple Myeloma Ovarian Melanoma Non-small cell lung cancer Investigator Initiated studies Cohort 1: High NY-ESO expression, 12 patients Cohort 2: Low NY-ESO expression, 10 patients Cohort 3: Removal of fludarabine, 10 patients *Cohort 4: Modified CTX / fludarabine, 10 patients 10 patients 6 patients 10 patients, Stage IIIb / IV NSCLC ATTACK: Esophageal: 12 patients Combination study, no auto SCT; 2 cohorts Autologous SCT, 25 patients (Rapoport Nat Med, 2015) NCI: synovial sarcoma (16 patients) and melanoma (13 patients) Complete Enrolling Enrolling Enrolling Enrolling; potential for combination study Complete Complete In planning Initiated Q4 2015 Active; recruitment to resume 124 Opening 2016 *Pending analysis of cohort 3
Sarcomas A diverse collection of uncommon mesenchymal tumors GIST Bone Leiomyosarcoma Liposarcoma Unclassified Ducimetiere et al. PLoS ONE 6(8): e20294. doi:10.1371/journal.pone.0020294. epub AUG 2011 125
Sarcoma demographics and mortality Disease Incidence US/EU Annual Mortality US/EU Synovial Sarcoma & Myxoid Round Cell Liposarcoma 2,400-3,000 840-1,050 RELAPSED METASTATIC SOFT TISSUE SARCOMA REPRESENTS AN UNMEt MEDICAL NEED Breakthrough Designation: Granted in the U.S. on February 4, 2016 “for the treatment of HLA-A*0201, HLA-A*0205, HLA-A*020 allele-positive patients with inoperable or metastatic synovial sarcoma who have received prior chemotherapy and whose tumor expresses the NY-ESO-1 tumor antigen” Orphan Designation: Granted in the U.S. on March 29, 2016 “autologous CD4+/CD8+ NY-ESO-1c259-T cells for the treatment of soft tissue sarcoma” 126
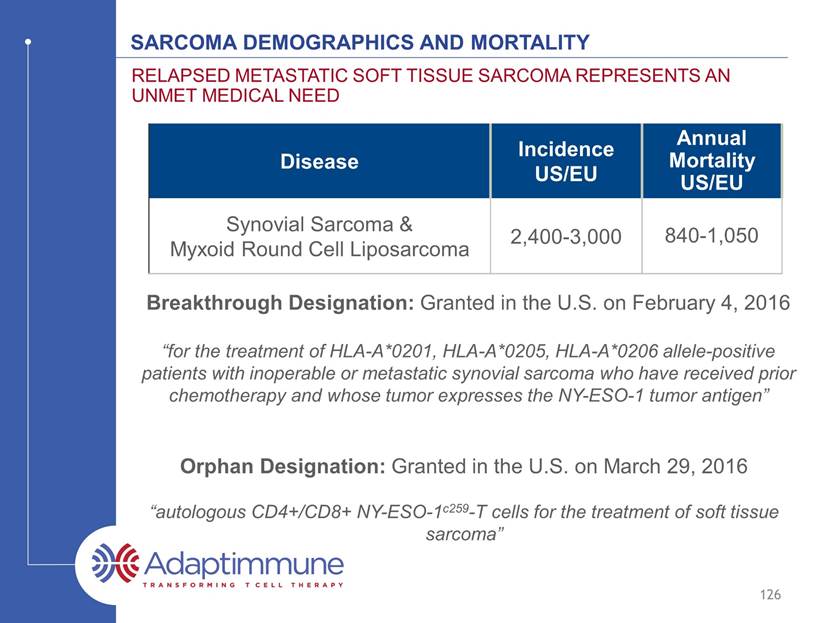
Represent 30-35% of all liposarcomas; 10% of all soft tissue sarcomas 80-90% express NY-ESO at high levels Characterized by chromosomal translocation (t(12;16)(q13;p11); as in the case of synovial sarcomas, it allows for accurate diagnosis) Present primarily in the extremities, particularly the thigh, and in the trunk and retroperitoneum Localized disease is managed with surgery, radiation and chemotherapy One third of patients develop metastatic disease with multifocal spread, commonly to the bone and lungs. Chemotherapy has a limited, non-curative role in metastatic disease NEXT SOFT TISSUE SARCOMA TO BE STUDIED WITH ADAPTIMMUNE’S NY-ESO-1 TCR 127 Myxoid Round cell liposarcoma WHO Classification: https://www.iarc.fr/en/publications/pdfs-online/pat-gen/bb5/bb5-classifsofttissue.pdf
Myxoid Round cell liposarcoma NY-ESO is highly expressed in the majority of mrcLS 128 Hemminger J, Modern Pathology 26, 2013 Myxoid component Round cell component NY-ESO H & E
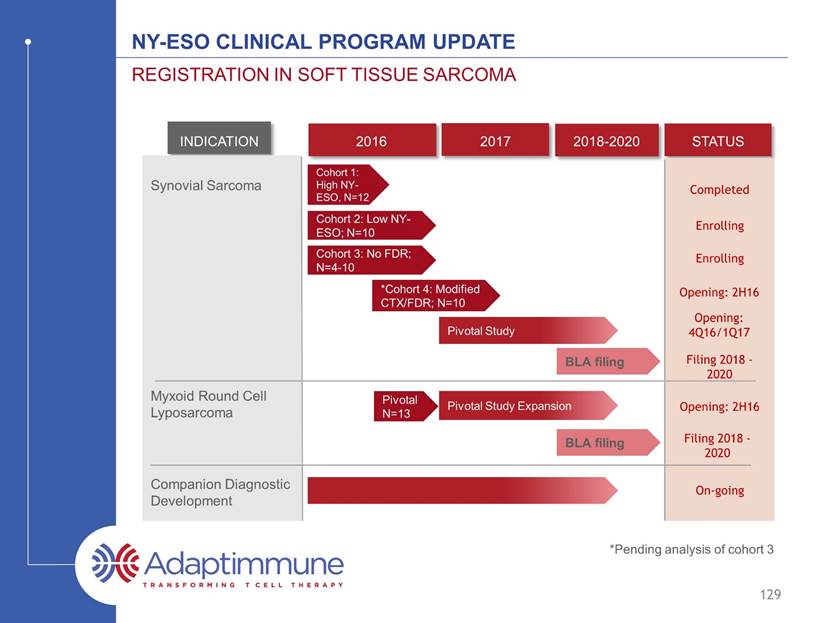
NY-ESO Clinical Program Update Registration in soft tissue sarcoma Synovial Sarcoma Myxoid Round Cell Lyposarcoma Pivotal Study Expansion Pivotal Study *Cohort 4: Modified CTX/FDR; N=10 Opening: 4Q16/1Q17 Opening: 2H16 Cohort 3: No FDR; N=4-10 Cohort 2: Low NY-ESO; N=10 Cohort 1: High NY-ESO, N=12 Completed Enrolling Enrolling Companion Diagnostic Development Pivotal N=13 Opening: 2H16 On-going INDICATION 2016 2017 2018-2020 STATUS BLA filing BLA filing Filing 2018 - 2020 Filing 2018 - 2020 *Pending analysis of cohort 3 129
INDUSTRY-LEADING TCR PIPELINE IN SOLID AND HEMATOLOGIC CANCERS ONGOING PROGRAMS FOR NY-ESO INDICATION RESEARCH PRE-IND PHASE I/II STATUS Synovial Sarcoma Multiple Myeloma Ovarian Melanoma Non-small cell lung cancer Investigator Initiated studies Cohort 1: High NY-ESO expression, 12 patients Cohort 2: Low NY-ESO expression, 10 patients Cohort 3: Removal of fludarabine, 10 patients *Cohort 4: Modified CTX / fludarabine, 10 patients 10 patients 6 patients 10 patients, Stage IIIb / IV NSCLC ATTACK: Esophageal: 12 patients Combination study, no auto SCT; 2 cohorts Autologous SCT, 25 patients. (Rapoport Nat Med, 2015) NCI: synovial sarcoma (16 patients) and melanoma (13 patients) Complete Enrolling Enrolling Enrolling Enrolling; potential for combination study Complete Complete In planning Initiated Q4 2015 Active; recruitment to resume 130 Opening 2016 *Pending analysis of cohort 3
NY-ESO expression across tumor types Melanoma Ovarian NSCLC Myeloma US1 9,940 14,180 158,040 11,240 EU2 12,051 42,716 254,532 12,213 Estimated Annual Deaths* Source: seer.cancer.gov Source: eco.iarc.fr/eucan * HLA02 represents approx. 40-50% of these patients 131 NY-ESO-1 is expressed at low to medium levels across a wide range of tumors
NY-ESO program 2016 development Milestones and data Flow 132 TARGET DATE MILESTONE COMPLETED Initiation of first combination study Initiation of Myxoid Round Cell Liposarcoma Study Breakthrough designation for NY-ESO in synovial sarcoma Orphan drug designation for NY-ESO in soft tissue sarcoma Initiation of pivotal synovial sarcoma study Additional phase I/II data from clinical studies in: Sarcoma Myeloma Lung Melanoma 2H 2016 2H 2016 1H 2016 2H 2016 4Q 2016 4Q16/1Q17 Ovarian
Adaptimmune Investor and analyst day 2016 Accelerating Adaptimmune’s Wholly-Owned Clinical Pipeline April 22, 2016

NY-ESO Clinical Program Update Deep pipeline of wholly-owned TCRs 134 Non-Small Cell Lung Cancer (NSCLC) Multiple cancer types MAGE-A4 TCR INDs in 2017+ RAC and IND submission in 2017 AFP TCR MAGE-A10 TCR MAGE-A10 TCR dose escalation Initiated Q4 2015 Initiate in 2016 IND open; enrollment in 2016 Multiple cancer types Undisclosed INDICATION RESEARCH PRE-IND PHASE I/II STATUS Urothelial Melanoma Head and neck Hepatocellular cancer Multiple cancer types Generation 2 and 3 TCRs INDs from 2017+
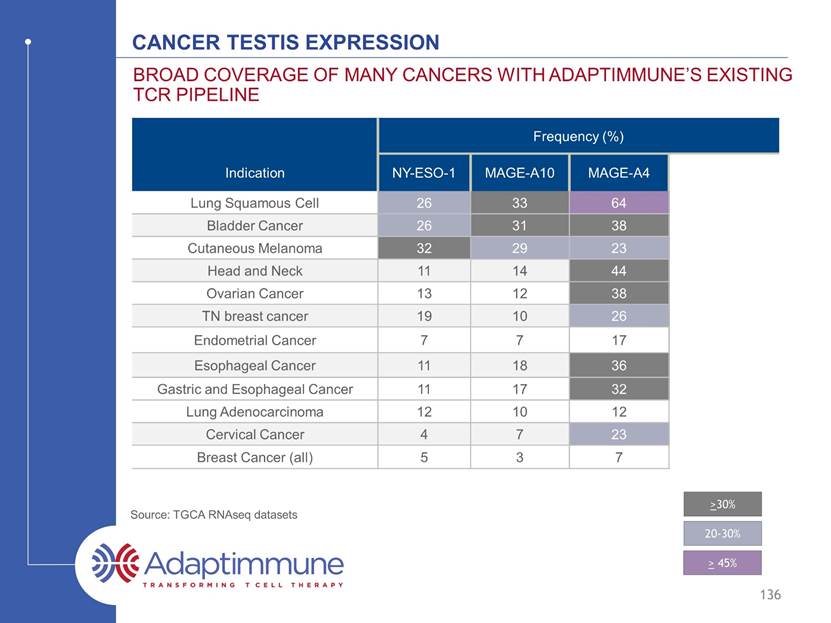
Cancer testis expression Frequency (%) Indication NY-ESO-1 MAGE-A10 MAGE-A4 Expression by 1 or more Lung Squamous Cell 26 33 64 69 Bladder Cancer 26 31 38 50 Cutaneous Melanoma 32 29 23 48 Head and Neck 11 14 44 46 Ovarian Cancer 13 12 38 44 TN breast cancer 19 10 26 35 Endometrial Cancer 7 7 17 21 Esophageal Cancer 11 18 36 40 Gastric and Esophageal Cancer 11 17 32 35 Lung Adenocarcinoma 12 10 12 19 Cervical Cancer 4 7 23 26 Breast Cancer (all) 5 3 7 11 BROAD coverage of many cancers WITH ADAPTIMMUNE’S EXISTING TCR PIPELINE 135 Source: TGCA RNAseq datasets >30% 20-30% > 45%
Cancer testis expression Frequency (%) Indication NY-ESO-1 MAGE-A10 MAGE-A4 Expression by 1 or more Lung Squamous Cell 26 33 64 69 Bladder Cancer 26 31 38 50 Cutaneous Melanoma 32 29 23 48 Head and Neck 11 14 44 46 Ovarian Cancer 13 12 38 44 TN breast cancer 19 10 26 35 Endometrial Cancer 7 7 17 21 Esophageal Cancer 11 18 36 40 Gastric and Esophageal Cancer 11 17 32 35 Lung Adenocarcinoma 12 10 12 19 Cervical Cancer 4 7 23 26 Breast Cancer (all) 5 3 7 11 BROAD coverage of many cancers WITH ADAPTIMMUNE’S EXISTING TCR PIPELINE 136 Source: TGCA RNAseq datasets >30% 20-30% > 45%
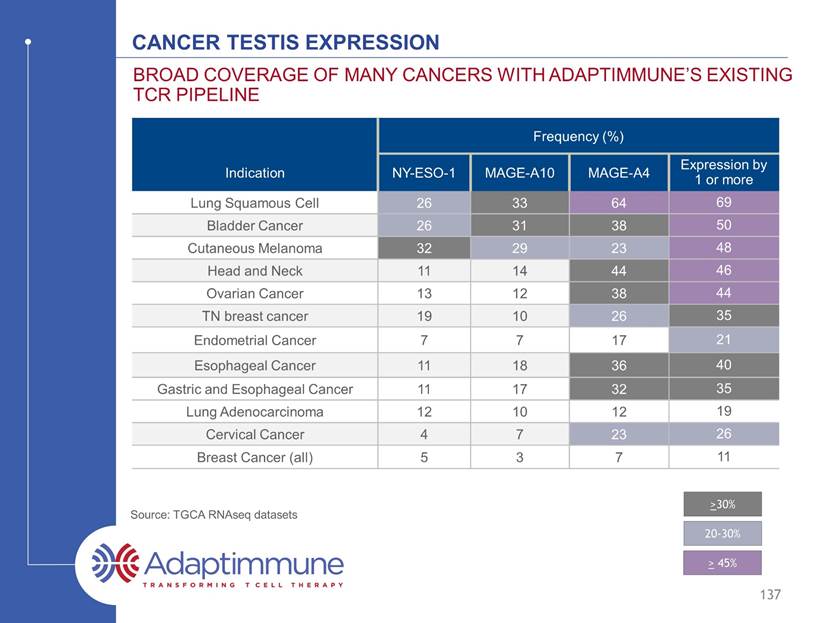
Cancer testis expression Frequency (%) Indication NY-ESO-1 MAGE-A10 MAGE-A4 Expression by 1 or more Lung Squamous Cell 26 33 64 69 Bladder Cancer 26 31 38 50 Cutaneous Melanoma 32 29 23 48 Head and Neck 11 14 44 46 Ovarian Cancer 13 12 38 44 TN breast cancer 19 10 26 35 Endometrial Cancer 7 7 17 21 Esophageal Cancer 11 18 36 40 Gastric and Esophageal Cancer 11 17 32 35 Lung Adenocarcinoma 12 10 12 19 Cervical Cancer 4 7 23 26 Breast Cancer (all) 5 3 7 11 BROAD coverage of many cancers WITH ADAPTIMMUNE’S EXISTING TCR PIPELINE 137 Source: TGCA RNAseq datasets >30% 20-30% > 45%
Wholly-owned pipeline 2016 development Milestones and data Flow 138 TARGET DATE MILESTONE COMPLETED File IND for MAGE-A4 Complete enrollment in NSCLC dose-escalation study for MAGE-A10 Initiate AFP clinical study Initiate MAGE-A10 multi-tumor study 2017 2H 2016 2H 2016 2H 2016 File and open IND for AFP TCR 1H 2016
SUMMARY Rapid progress with NY-ESO-1 in sarcoma, anticipate initiating pivotal trials around year end 2016 Broad tumor coverage across Adaptimmune’s clinical pipeline Multiple studies examining efficacy of NY-ESO-1 in additional indications Expect to initiate combination trials with NY-ESO-1 and check-point inhibitor in 2016 Delivering on internal pipeline; 2 active INDs in the past 8 months MAGE-A10 study in bladder cancer, ovarian cancer and melanoma, in addition to the ongoing NSCLC study Open IND with AFP TCR; enrollment to start in 2016 Next IND in 2017: MAGE-A4 High level of expression in multiple tumor types 139
Adaptimmune Investor and analyst day 2016 Adaptimmune Pipeline Engine: An abundance of potential targets and preclinical candidates April 22, 2016 Gwen Binder-Scholl, Ph.D. Chief Technology Officer
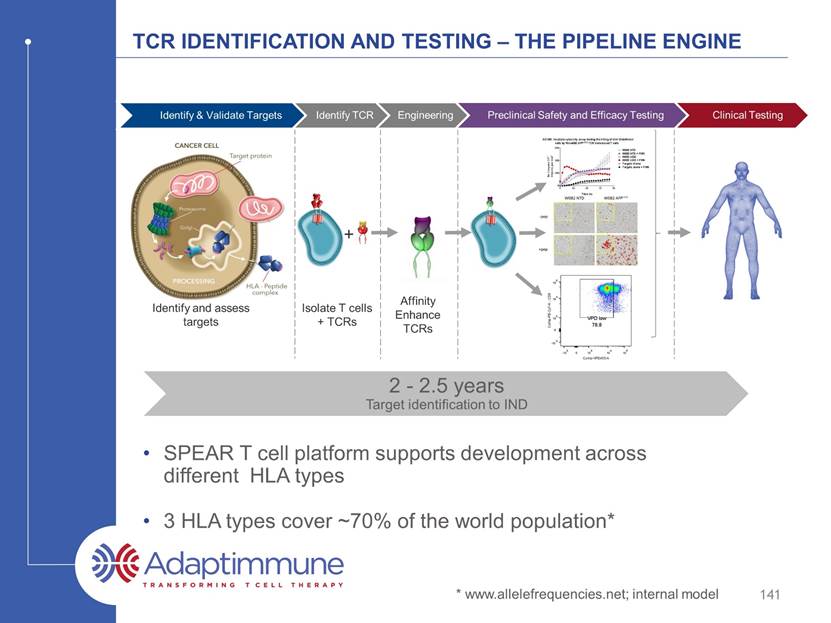
TCR identification and testing – The pipeline engine Isolate T cells + TCRs + Affinity Enhance TCRs Identify and assess targets Identify & Validate Targets Identify TCR Engineering Preclinical Safety and Efficacy Testing Clinical Testing 141 2.5 to 3 years Target identification to NDA 2 - 2.5 years Target identification to IND SPEAR platform supports development across different HLA types 3 HLA types cover ~70% of the world population* * www.allelefrequencies.net; internal model
TCR identification and testing – The pipeline engine Isolate T cells + TCRs + Affinity Enhance TCRs Identify and assess targets Identify & Validate Targets Identify TCR Engineering Preclinical Safety and Efficacy Testing Clinical Testing 142 2.5 to 3 years Target identification to NDA 2 - 2.5 years Target identification to IND
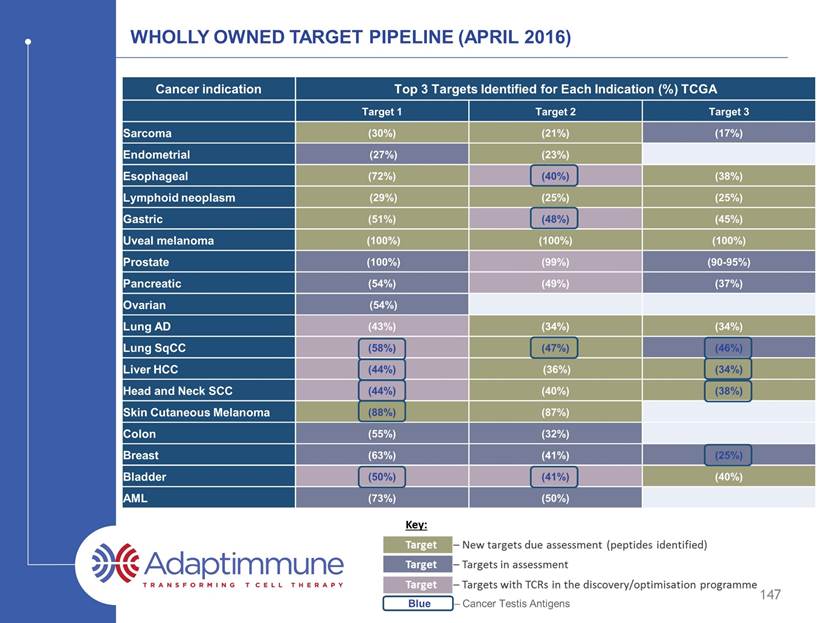
Technology allows Adaptimmune to find tumor-associated targets New Target selection driven by clinical priorities Number of Targets Multiple new targets identified across indications* * Examples to demonstrate the breadth of targets; actual indications selected for development are not disclosed 143
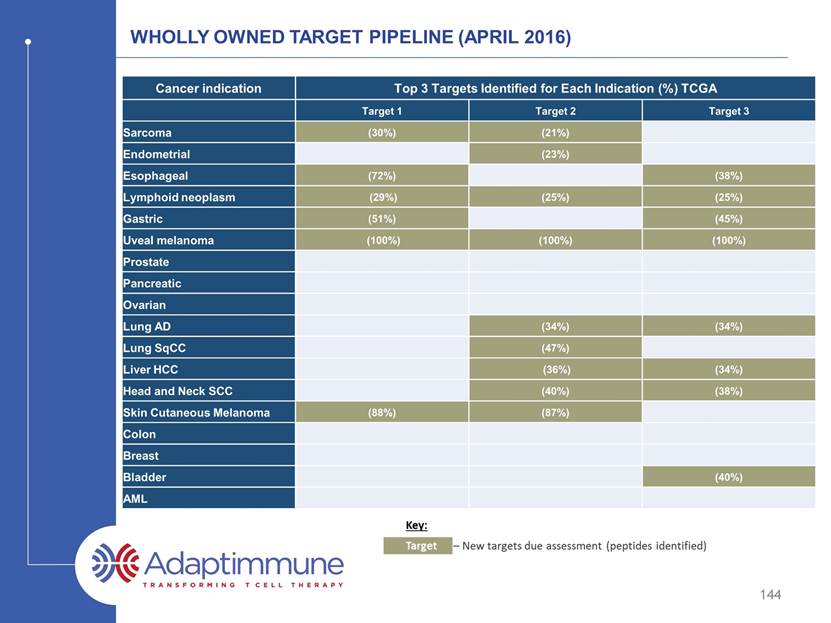
144 WHOLLY OWNED TARGET PIPELINE (APRIL 2016) Cancer indication Peptides for Top 3 Targets Overexpressed in Indication (%) TCGA Peptide 1 Peptide 2 Peptide 3 Sarcoma (30%) (21%) Endometrial (23%) Esophageal (72%) (38%) Lymphoid neoplasm (29%) (25%) (25%) Gastric (51%) (45%) Uveal melanoma (100%) (100%) (100%) Prostate Pancreatic Ovarian Lung AD (34%) (34%) Lung SqCC (47%) Liver HCC (36%) (34%) Head and Neck SCC (40%) (38%) Skin Cutaneous Melanoma (88%) (87%) Colon Breast Bladder (40%) AML
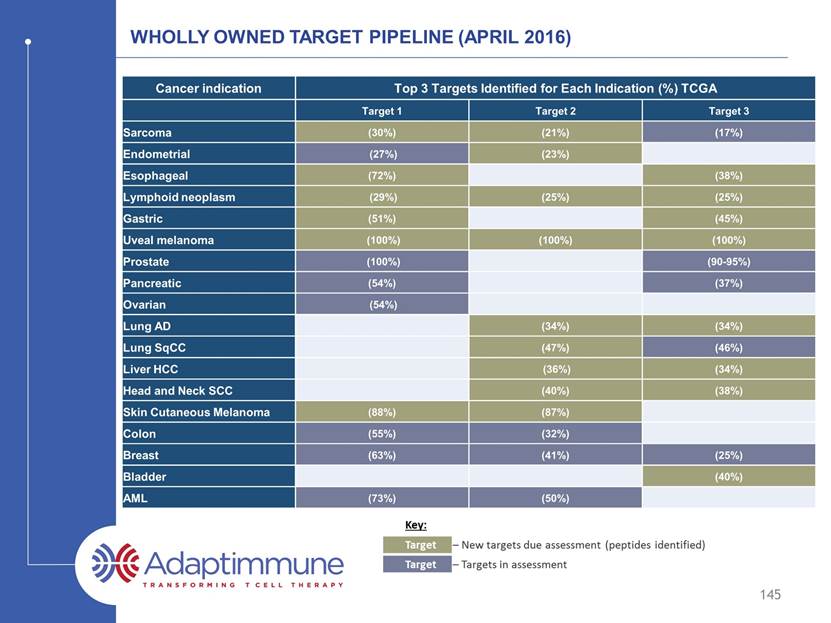
145 WHOLLY OWNED TARGET PIPELINE (APRIL 2016) Cancer indication Peptides for Top 3 Targets Overexpressed in Indication (%) TCGA Peptide 1 Peptide 2 Peptide 3 Sarcoma (30%) (21%) (17%) Endometrial (27%) (23%) Esophageal (72%) (38%) Lymphoid neoplasm (29%) (25%) (25%) Gastric (51%) (45%) Uveal melanoma (100%) (100%) (100%) Prostate (100%) (90-95%) Pancreatic (54%) (37%) Ovarian (54%) Lung AD (34%) (34%) Lung SqCC (47%) (46%) Liver HCC (36%) (34%) Head and Neck SCC (40%) (38%) Skin Cutaneous Melanoma (88%) (87%) Colon (55%) (32%) Breast (63%) (41%) (25%) Bladder (40%) AML (73%) (50%)
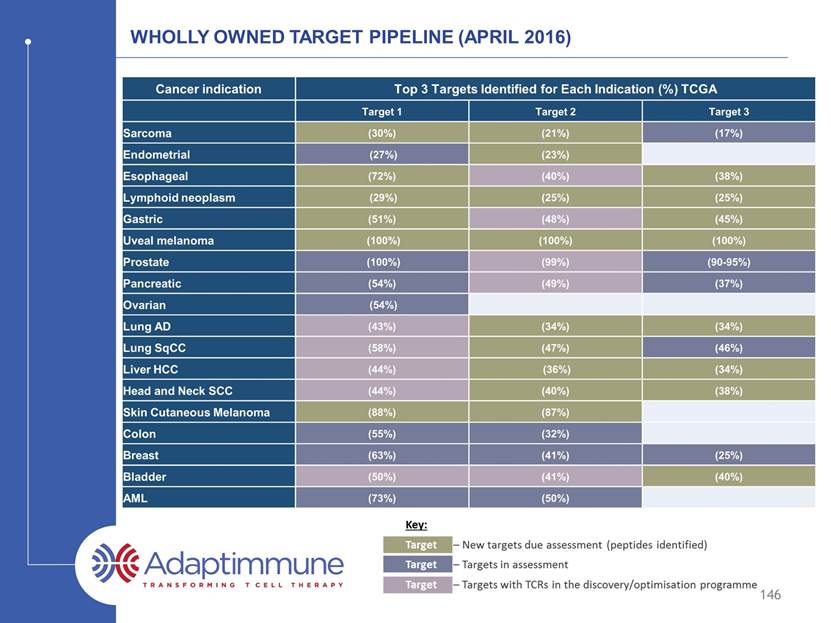
146 WHOLLY OWNED TARGET PIPELINE (APRIL 2016) Cancer indication Peptides for Top 3 Targets Overexpressed in Indication (%) TCGA Peptide 1 Peptide 2 Peptide 3 Sarcoma (30%) (21%) (17%) Endometrial (27%) (23%) Esophageal (72%) (40%) (38%) Lymphoid neoplasm (29%) (25%) (25%) Gastric (51%) (48%) (45%) Uveal melanoma (100%) (100%) (100%) Prostate (100%) (99%) (90-95%) Pancreatic (54%) (49%) (37%) Ovarian (54%) Lung AD (43%) (34%) (34%) Lung SqCC (58%) (47%) (46%) Liver HCC (44%) (36%) (34%) Head and Neck SCC (44%) (40%) (38%) Skin Cutaneous Melanoma (88%) (87%) Colon (55%) (32%) Breast (63%) (41%) (25%) Bladder (50%) (41%) (40%) AML (73%) (50%)
147 WHOLLY OWNED TARGET PIPELINE (APRIL 2016) Cancer indication Peptides for Top 3 Targets Overexpressed in Indication (%) TCGA Peptide 1 Peptide 2 Peptide 3 Sarcoma (30%) (21%) (17%) Endometrial (27%) (23%) Esophageal (72%) (40%) (38%) Lymphoid neoplasm (29%) (25%) (25%) Gastric (51%) (48%) (45%) Uveal melanoma (100%) (100%) (100%) Prostate (100%) (99%) (90-95%) Pancreatic (54%) (49%) (37%) Ovarian (54%) Lung AD (43%) (34%) (34%) Lung SqCC (58%) (47%) (46%) Liver HCC (44%) (36%) (34%) Head and Neck SCC (44%) (40%) (38%) Skin Cutaneous Melanoma (88%) (87%) Colon (55%) (32%) Breast (63%) (41%) (25%) Bladder (50%) (41%) (40%) AML (73%) (50%) Blue – Cancer Testis Antigens
Target Validation Clinical Portfolio TCR Discovery Target Identification 2016 2017 2018 2019 Myeloma Melanoma Ovarian Sarcoma NSCLC Head and Neck Gastric Bladder AFP NY-ESO-1 MAGE-A10 148 Multiple targets to enter clinic in next 3 years Multiple INDs from 2017 onwards (targets and next generation) Liver All programs are run under Adaptimmune-owned INDs. Next generation programs not represented on this chart.
Target Validation Clinical Portfolio TCR Discovery Target Identification 2016 2017 2018 2019 Myeloma Melanoma Ovarian Sarcoma NSCLC Head and Neck Gastric Bladder Mage-A4 plus 1 other validated target Multiple tumor indications AFP NY-ESO-1 MAGE-A10 Preclinical Discovery 149 Multiple targets to enter clinic in next 3 years Multiple INDs from 2017 onwards (targets and next generation) Liver All programs are run under Adaptimmune-owned INDs. Next generation programs not represented on this chart.
Target Validation Clinical Portfolio TCR Discovery Target Identification 2016 2017 2018 2019 Identification Assessment Discovery Preclinical Myeloma Melanoma Ovarian Sarcoma NSCLC Head and Neck Gastric Bladder 11 targets 6 targets 6 targets Mage-A4 plus 1 other validated target Multiple tumor indications AFP NY-ESO-1 MAGE-A10 Preclinical Discovery Discovery Assessment Preclinical 150 * * * * Early targets – attrition expected Multiple targets to enter clinic in next 3 years Multiple INDs from 2017 onwards (targets and next generation) Liver All programs are run under Adaptimmune-owned INDs. Next generation programs not represented on this chart.
TCR identification and testing – The pipeline engine Isolate T cells + TCRs + Affinity Enhance TCRs Identify and assess targets Identify & Validate Targets Identify TCR Engineering Preclinical Safety and Efficacy Testing Clinical Testing 151 2.5 to 3 years Target identification to NDA 2 - 2.5 years Target identification to IND
cancer antigen specific tcrs from clones and libraries Original isolates display A wide range of affinities MAGE-A4 MAGE-A10 AFP 152 Strong Weak Antigen recognition Virus TCRs Naturally-occurring Cancer TCRs Selected from a pool of 21 parental TCRs supra-natural TCR Single clone Selected from a pool of 69 parental TCRs Aleksic, M. et al. (2012). Eur J Immunol 10.1002/eji.201242606
Affinity optimization is important in all cases so far Aleksic, M. et al. (2012). Eur J Immunol 10.1002/eji.201242606 153 Strong Weak Antigen recognition MAGE-A4 TCR Optimized Mage-A4 TCR MAGE-A10 TCR Optimized Mage-A10 TCR AFP TCR Optimized AFP TCR Virus TCRs Naturally-occurring Cancer TCRs Independent of starting affinity, optimization is relevant Having multiple parental TCRs to start from allows selection of the most specific TCR. The ideal affinity is different for each TCR and not possible to predict.
Each tcr has a window of enhanced potency 154 It is possible to over-engineer – this is carefully monitored Increasing TCR affinity No TCR HepG2 (A2+, AFP+) JHH5.A2 (A2+, AFP+) HuH6 (A2low, AFP+) Hep3B (A2-, AFP+) HEP2 (A2+, AFP-) HEP3 (A2+, AFP-) Hepatocellular Carcinoma lines Normal Hepatocytes Natural Affinity 352 350 332 351 349 353 326 Potency Cross-reactivity Clinical Candidate Enhanced affinity TCR candidates
TCR identification and testing – The pipeline engine Isolate T cells + TCRs + Affinity Enhance TCRs Identify and assess targets Identify & Validate Targets Identify TCR Engineering Preclinical Safety and Efficacy Testing Clinical Testing 155 TCR specificity is mapped by X-scanning Alloreactivity and further TCR specificity tested in cell-based assays Potency tested in primary tumor and tumor cell lines
summary Multiple tumor associated targets across oncology indications – nearly every indication can be addressed Affinity optimization is important for optimal efficacy, but The ideal affinity must be empirically determined Adaptimmune has a unique set of tools to ensure specificity of engineered TCRs The SPEAR T cell platform supports development across multiple HLA types Multiple company-owned INDs from 2017 onwards Includes new targets, and next generation cells Adaptimmune has a pipeline for an industry 156
Adaptimmune Scientific advisory Board Crystal Mackall, M.D., Chair, Adaptimmune Scientific Advisory Board; Professor of Pediatrics and Medicine; Associate Director of the Stanford Cancer Institute Nabil Ahmed, M.D., Associate Professor, Department of Pediatrics, Texas Children's Hospital, Texas Children’s Cancer Center; Center for Cell and Gene Therapy, Houston Methodist Hospital, Baylor College of Medicine Michael Dustin, Ph.D., Professor of Immunology and Wellcome Principal Research Fellow, Director of Research of the Kennedy Institute, Oxford, UK Keith Flaherty, M.D., Keith Flaherty, M.D., Professor, Medicine, Harvard Medical School; Director of Termeer Center for Target Therapy, Cancer Center, Massachusetts General Hospital Wolf Fridman, M.D., Ph.D., Professor Emeritus of Immunology , Paris Descartes University Medical School, Paris, France; President, Canceropole Ile de France 157 Arlene Sharpe, M.D., Ph.D., Fabyan Professor of Comparative Pathology, Microbiology and Immunobiology, Harvard Medical School Vice Chair for Education, Pathology, Harvard Medical School; Co-Director, The Harvard Institute of Translational Immunology (HITI) Mario Sznol, M.D., Professor, Internal Medicine; Leader, Disease-Related Research Team, Melanoma and Renal cell Carcinoma; Vice-Chief, Medical Oncology; Co-Director, Yale Skin SPORE, Yale Cancer Center Thomas Gajewski, M.D., Ph.D., Professor, Department of Pathology, The Ben May Department for Cancer Research, Department of Medicine - Section of Hematology/Oncology, University of Chicago Medical Center Steve Grupp, M.D., Ph.D., Novotny Professor of Pediatrics, University of Pennsylvania Perelman School of Medicine; Director, Cancer Immunotherapy Frontier Program; Director of Translational Research, Children’s Hospital of Philadelphia
Adaptimmune Investor and analyst day 2016 Manufacturing excellence and commercial delivery April 22, 2016
Manufacturing Process Overview 159 Clinical sites across the globe Fully closed system 8-10 day release testing D D
Manufacturing Process Overview 160 Clinical sites across the globe Fully closed system 8-10 day release testing
Manufacturing Process Overview 161 Clinical sites across the globe Fully closed system 8-10 day release testing d d d d d
Manufacturing Process Overview 162 Clinical sites across the globe Fully closed system 8-10 day release testing d d d d d
Manufacturing Process Overview 163 Clinical sites across the globe Fully closed system 8-10 day release testing
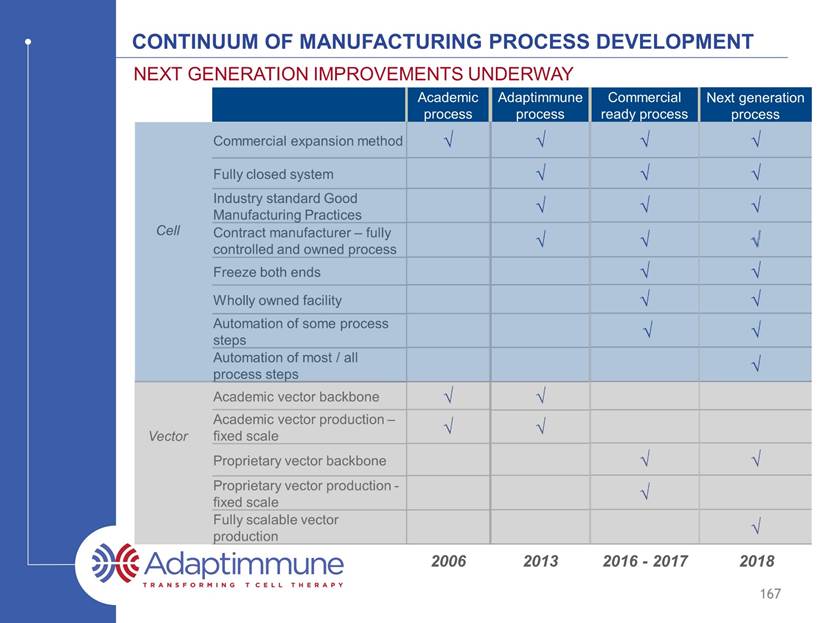
Continuum of manufacturing process development Commercial expansion method Fully closed system Industry standard Good Manufacturing Practices Contract manufacturer – fully controlled and owned process Freeze both ends Wholly owned facility Automation of some process steps Automation of most / all process steps Academic vector backbone Academic vector production – fixed scale Proprietary vector backbone Proprietary vector production - fixed scale Fully scalable vector production Initially developed at university of Pennsylvania* 164 Academic process Cell Vector 2006 *Levine et al, J Immunol, 1997
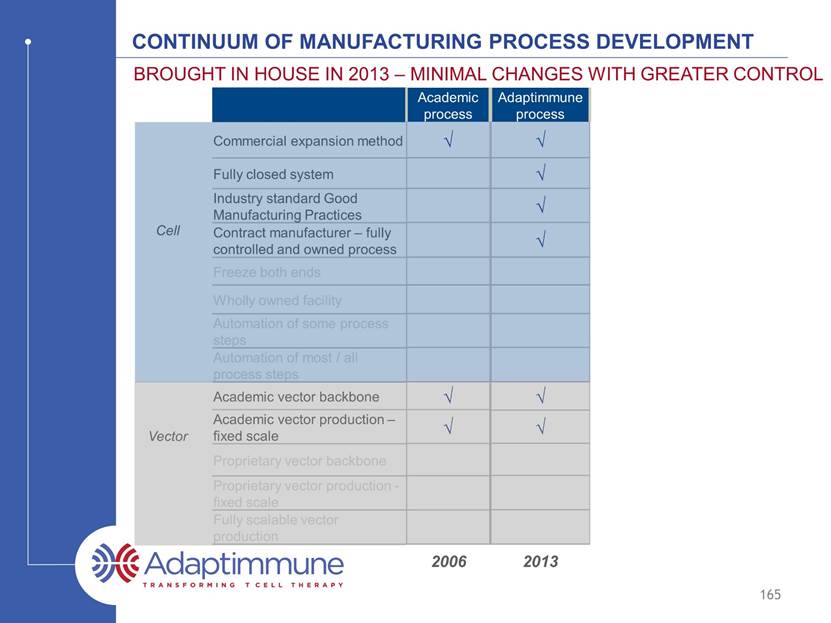
Continuum of manufacturing process development Commercial expansion method Fully closed system Industry standard Good Manufacturing Practices Contract manufacturer – fully controlled and owned process Freeze both ends Wholly owned facility Automation of some process steps Automation of most / all process steps Academic vector backbone Academic vector production – fixed scale Proprietary vector backbone Proprietary vector production - fixed scale Fully scalable vector production Brought in house in 2011 – minimal changes with greater control 165 Academic process Adaptimmune process Cell Vector 2006 2011
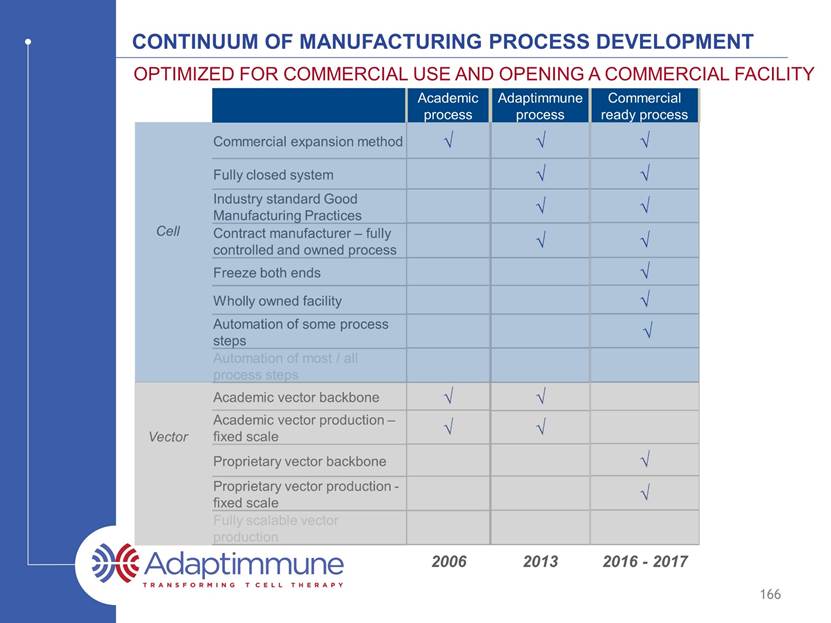
Continuum of manufacturing process development Commercial expansion method Fully closed system Industry standard Good Manufacturing Practices Contract manufacturer – fully controlled and owned process Freeze both ends Wholly owned facility Automation of some process steps Automation of most / all process steps Academic vector backbone Academic vector production – fixed scale Proprietary vector backbone Proprietary vector production - fixed scale Fully scalable vector production Optimized for commercial use and opening a commercial facility 166 Academic process Adaptimmune process Commercial ready process Cell Vector 2006 2011 2016 - 2017
Continuum of manufacturing process development Commercial expansion method Fully closed system Industry standard Good Manufacturing Practices Contract manufacturer – fully controlled and owned process Freeze both ends Wholly owned facility Automation of some process steps Automation of most / all process steps Academic vector backbone Academic vector production – fixed scale Proprietary vector backbone Proprietary vector production - fixed scale Fully scalable vector production Next generation improvements underway 167 Academic process Adaptimmune process Commercial ready process Next generation process ? Cell Vector 2006 2011 2016 - 2017 2018
Key objectives of ex vivo T cell manufacturing Select the right T cells for anti-tumor efficacy Gene modify and activate / rejuvenate these T cells to generate potency Expand these T cells to meet the target dose for patients Build in manufacturing flexibility – freeze the product at both ends 168 Adaptimmune’s manufacturing meets these objectives
Ability to expand the T cells to Deliver Required Dose T cells expanded on average 40-fold in ex vivo culture Expansion 10-12 day 169 Minimizes vector usage at culture start (cost of goods reduction) Apheresis always yields sufficient cells for manufacture Target patient dose routinely achieved T cells (billions) D 0 D 3 ( p w ) D 4 D 5 D 6 D 7 D 8 D 9 D 1 0 D 1 1 D 1 2 0 5 10 15 20 Day of culture T N C i n B i l l i o n s
Ability to expand the T cells to Deliver Required Dose Routinely meets required patient dose Expansion 10-12 day Approximate minimum dose* 170 Approximate target dose* * dependent on frequency of gene transduction – typically ~50% T cells (billions) D 0 D 3 ( p w ) D 4 D 5 D 6 D 7 D 8 D 9 D 1 0 D 1 1 D 1 2 0 5 10 15 20 Day of culture T N C i n B i l l i o n s
Ability to expand the T cells to Deliver Required Dose Culture beyond 6 days required to achieve adequate product Expansion 10-12 day The majority of expansion occurs day 6-12 171 T cells (billions) D 0 D 3 ( p w ) D 4 D 5 D 6 D 7 D 8 D 9 D 1 0 D 1 1 D 1 2 0 5 10 15 20 Day of culture T N C i n B i l l i o n s
Ability to expand the T cells to Deliver Required Dose Release testing – an important safety requirement Expansion 10-12 day Release testing (10 day) All engineered T cell therapy products are required to undergo post production release testing 20-22 days vein to vein 172 T cells (billions) D 0 D 3 ( p w ) D 4 D 5 D 6 D 7 D 8 D 9 D 1 0 D 1 1 D 1 2 0 5 10 15 20 Day of culture T N C i n B i l l i o n s
The method of T cell manufacturing is important Not all methods are equal T cells are expanded through triggering of the TCR and provision of a second signal (to overcome peripheral tolerance mechanisms) Original manufacturing method – used in academic studies Anti-CD3 (TCR signal) antibody (OKT-3) with IL-2* Exogenous feeder cells often added to improve expansion (co-stimulation)** 173 * Better et al, 2014 ASCO abstract #3079 (Kite) ** Morgan et al, Science, 2006; Riddell and Greenberg, J Immunol Meth (1990)
T cells are expanded through triggering of the TCR and provision of a second signal (to overcome tolerance mechanisms) Original manufacturing method – used in academic studies: Anti-CD3 (TCR signal) antibody (OKT-3) with IL-2 Exogenous feeder cells often added to improve expansion (co-stimulation) Methods of manufacturing Commercial method: Co-ordinated activation and co-stimulation through CD3 and CD28 ligation* Magnetic beads bound to anti-CD3 and CD28 antibodies - easy to add and remove Good safety record to date – hundreds of patients treated** Used by Novartis under exclusive license for CAR-T*** Dynabeads® CD3/CD28 reagent** 174 Manufacturing the Best T cells beads T cell * Levine et al, J Immunol, 1997 ** source: internal *** source: Thermo Fisher website
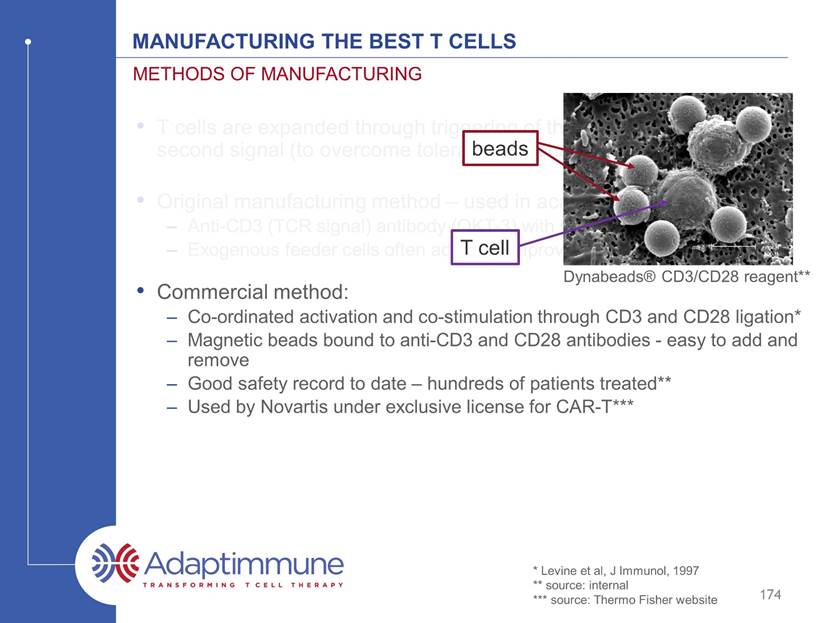
T cells are expanded through triggering of the TCR and provision of a second signal (to overcome tolerance mechanisms) Original manufacturing method – used in academic studies: Anti-CD3 (TCR signal) antibody (OKT-3) with IL-2 Exogenous feeder cells often added to improve expansion (co-stimulation) Methods of manufacturing Commercial method: Co-ordinated activation and co-stimulation through CD3 and CD28 ligation* Magnetic beads bound to anti-CD3 and CD28 antibodies - easy to add and remove Good safety record to date – hundreds of patients treated** Used by Novartis under exclusive license for CAR-T*** Dynabeads® CD3/CD28 reagent** 175 Manufacturing the Best T cells beads T cell * Levine et al, J Immunol, 1997 ** source: internal *** source: Thermo Fisher website Patented IP exclusively licensed to Adaptimmune for TCR engineered T cell therapy De-risks regulatory path to licensure - all of our clinical data has been generated using this process Supports positive selection for CD4 and CD8 T cells
Manufacturing the Best T cells Benefits of the CD3/28 method (compared to anti-CD3 with IL-2) Have a higher telomerase activity Are younger (cells express the CD27+ and CD28+ markers) Have longer telomeres and greater replicative potential Have more of a central memory profile Have lower levels of senescence The importance of t cell activation with co-stimulation 176 Source: Better et al, 2014 ASCO abstract #3079 (Kite); Weng et al, JExpMed (1996)); Hamann et al, J Exp Med (1997); and Azuma, Phillips and Lanier, J Immunol (1993); Barrett et al, Cytotherapy (2014)
The benefits of simultaneous stimulation and co-stimulation 177 Data from: Barrett et al, Cytotherapy 2014 *method reported in Better et al, 2014 ASCO abstract #3079 Manufacturing the Best T cells OKT3+IL-2* CD3/CD28 CD45RO+/CD62L+ 30% +/- 2 76% +/- 4 * CD27+/CD28+ 31% +/- 1 81% +/- 6 * Markers of central memory Markers of T cell youth Adaptimmune process Events Relative telomere length 2000 4000 6000 8000 400 300 200 100 Control (no probe) Pre-stimulation OKT3 + IL-2 CD3/CD28 Beads Adaptimmune process (CD3/CD28 beads) significantly increases telomere length vs OKT3+IL-2
CD3/CD28 Bead method produces long term persisting T cells CAR and TCR products associated with long term persistence use this technology; some examples Scholler Tebas Rapoport (Adaptimmune data) 178 Manufacturing the Best T cells - years Source: Scholler et al, Mol Ther (2013); Tebas et al, Blood (2013); Rapoport et al, Nat Med (2015); Porter et al, STM (2015)
CDC3/CD28 method produces long term persisting T cells Long term expression of the TCR – no gene silencing Programming of central memory and stem central memory cells which are associated with enhanced antitumor responses 179 Manufacturing the Best T cells 5.96% 4.68% 3.38% 1.04% 1.09% NY-ESO Expression CD8 Expression Source: Gattinoni et al, Nat Med, 2011
Antigen-specific killing in a three dimensional tumor model T cells added here 180 Manufactured T cells are highly potent Tumor size* *GFP positive tumor – tumor size is measured by taking the average GFP fluorescence in the whole well; addition of T cells increases tumor size because they infiltrate the tumor MAGE-A10+ tumor alone MAGE-A10 TCR engineered T cells with MAGE-A10+ tumor Non engineered T cells with Mage-A10+ tumor Hours in culture 9 6 1 2 0 1 4 4 1 6 8 1 9 2 2 1 6 2 4 0 2 6 4 2 8 8 3 1 2 0 5 10 15 20 Time (h) N o r m a l i s e d T o t a l G F P F l u o r e s e n c e I n t e n s i t y o f ' S p h e r o i d C o r e ' ( A U ) A375-GFP Targets + NTD CTL A375-GFP Targets + MAGE-A10 796 CTL T cells added 136-140h A375-GFP Targets alone
Meeting clinical supply Experienced, industry-leading Contract manufacturers PCT (Allendale, NJ) >20,000 products made treating >6,000 patients 16 years of operation US and EU supply possible Dedicated space allocated for Adaptimmune MaSTherCell (Gosselies, BE) Authorized by AFMPS in 2013 Acquired by Orgenesis in 2015 EU supply Working with professional non-academic CMOs; well-controlled processes, GMP trained staff, commercial quality systems 181 Source: www.pctcaladrius.com; www.masthercell.com • •
Meeting commercial supply Located in the Philadelphia Navy Yard Biotechnology Park 10 minutes from the Philadelphia Airport; ideal for product logistics Dedicated manufacturing plant – opening early 2017 182
Meeting commercial supply Potential for up to 1,200 patients per year Build in a module fashion (3 planned, one shown here) Option to bring vector manufacture in-house Dedicated manufacturing Plant 183
Freeze at both ends enables flexible manufacturing scheduling Process Overview Key process elements to support commercial delivery 184 Collection Infusion
Positive selection of T cells 185 Process Overview Key process elements to support commercial delivery
Robust Expansion 40x 186 Process Overview Key process elements to support commercial delivery D 0 D 3 ( p w ) D 4 D 5 D 6 D 7 D 8 D 9 D 1 0 D 1 1 D 1 2 0 5 10 15 20 Day of culture T N C i n B i l l i o n s
FULLY CLOSED CELL MANUFACTURING PROCESS 187 Process Overview Key process elements to support commercial delivery
Incorporating automation in the cell process Automate most complex steps Retain flexibility in any automation plan, as the process will evolve with emerging scientific findings Reduces cost and promotes consistency 188 T cell isolation and transduction T cell harvest
Optimizing Transfer of TCR to the Cells Well established safety profile in T cells – no cases of insertional oncogenesis Efficient transduction at low vector input per cell (multiplicity of infection of 1 unit per cell) Optimized backbone for safety – WPRE removed to reduce perceived safety risks Lentiviral vector efficiently delivers TCR to T cells 189 % gene modification 1 virus particle per T cell added (MOI=1) Source: Kingsman, Mitrophanous, Olsen, Gene Therapy 2005
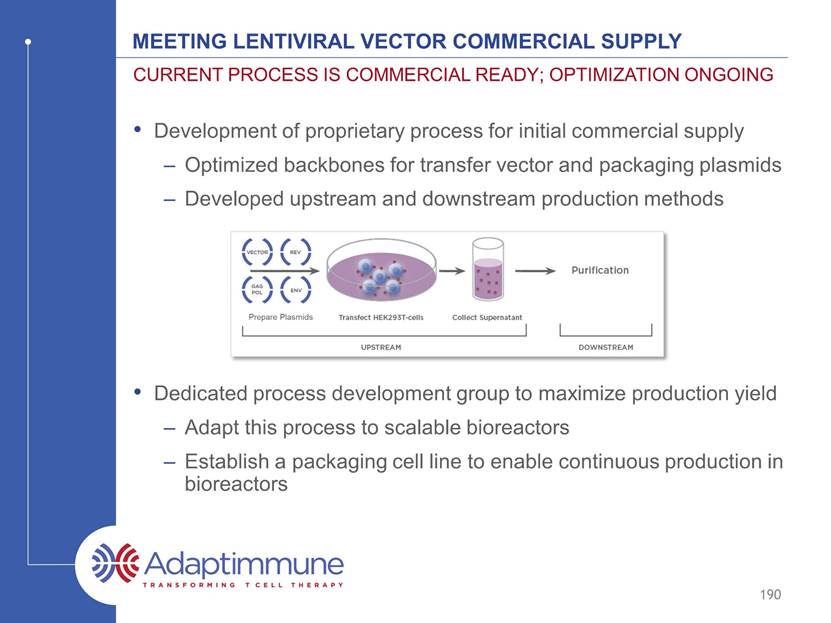
Meeting lentiviral vector commercial supply Development of proprietary process for initial commercial supply Optimized backbones for transfer vector and packaging plasmids Developed upstream and downstream production methods Dedicated process development group to maximize production yield Adapt this process to scalable bioreactors Establish a packaging cell line to enable continuous production in bioreactors Current process is commercial ready; optimization ongoing 190
Bringing it all together for commercial delivery Commercial expansion method Fully closed system Industry standard Good Manufacturing Practices Contract manufacturer – fully controlled and owned process Freeze both ends Wholly owned facility Automation of some process steps Automation of most / all process steps Academic vector backbone Academic vector production – fixed scale Proprietary vector backbone Proprietary vector production - fixed scale Fully scalable vector production Academic process Adaptimmune process Commercial ready process Cell Vector 2006 2011 2016 191
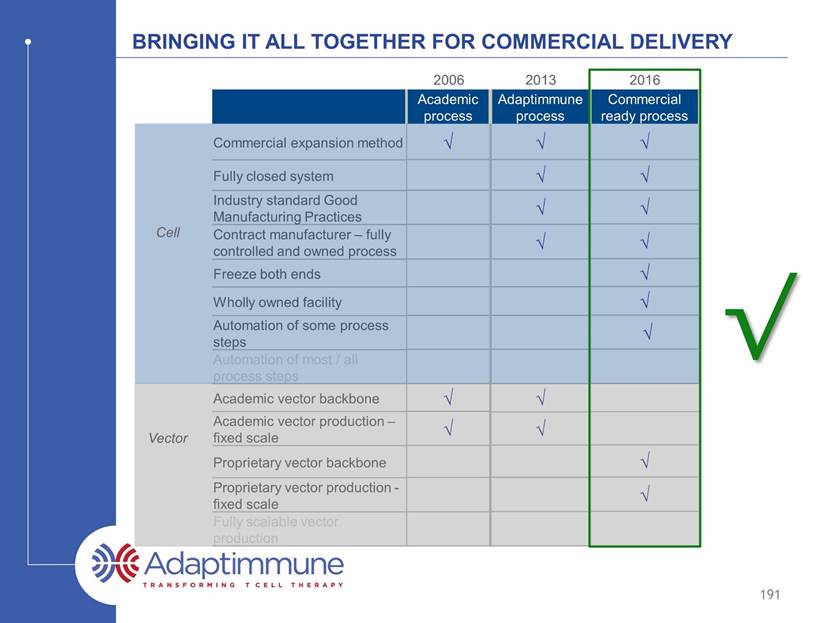
Adaptimmune Manufacturing summary Proprietary T cell expansion method Produces young, potent, persistent cells Routinely meets required patient doses Commercial ready process in place Fully closed No significant changes since initial trials – de-risks regulatory path Supply in place US and EU contract manufacturers in place Dedicated manufacturing plant opening in 2017 192 Not all t cell manufacturing methods are equal
Adaptimmune investor and analyst day 2016 Conclusion James Noble Chief Executive Officer, Adaptimmune
Adaptimmune: Leading the TCR T cell space Proprietary SPEAR T cell technology uniquely delivers: Correctly identified targets Specificity and optimal affinity “Supra-natural” TCRs to accelerate programs Enhanced effectiveness of TCRs: Generation 2 and 3 No other company can currently deliver all of these 194 Clear scientific leadership in the field of T cell engineering
Adaptimmune: Leading the TCR T cell space Proprietary SPEAR T cell technology uniquely delivers: Correctly identified targets Mass spectrometry critical Specificity and optimal affinity Adaptimmune platform finds window of safety and cross reactivity for each TCR “Supra-natural” TCRs to accelerate programs Numerous parental TCRs derived from libraries lead to multiple INDs Enhanced effectiveness of TCRs: Generation 2 and 3 Generation 2: Designed to overcome tumor microenvironment Generation 3: Designed to overcome epitope spreading and break tumor immune tolerance No other company can currently deliver all of these New data on above presented today 195 Clear scientific leadership in the field of T cell engineering
Adaptimmune: Leading the TCR T cell space Multiple clinical responses in synovial sarcoma, a solid tumor Over 90% response rate in multiple myeloma study in conjunction with ASCT No other company is as far advanced as Adaptimmune in the clinic with a TCR T cell 196 Clear scientific leadership in the field of T cell engineering Most compelling clinical data in the field
Adaptimmune: Leading the TCR T cell space Multiple clinical responses in synovial sarcoma, a solid tumor New images showing resolution of large solid lesions Cohort 2 suggests responses in low expressers Cohort 3 suggests importance of fludarabine Cohort 4 starting shortly Over 90% response rate in multiple myeloma study in conjunction with ASCT Median overall survival of ~3 years No other company is as far advanced as Adaptimmune in the clinic with a TCR T cell New updates presented on both diseases today Pivotal studies to start in 4Q16/1Q17 197 Clear scientific leadership in the field of T cell engineering Most compelling clinical data in the field
Adaptimmune: Leading the TCR T cell space Company INDs open for NY-ESO, MAGE-A10 and AFP These TCRs all derive from Adaptimmune’s proprietary technology No other company has routinely delivered INDs from in-house TCR platform 198 Clear scientific leadership in the field of T cell engineering Most compelling clinical data in the field Deep pipeline across major cancers
Adaptimmune: Leading the TCR T cell space Company INDs open for NY-ESO, MAGE-A10 and AFP MAGE-A4 next IND 2017 Generation 2 IND 2017 These TCRs all derive from Adaptimmune’s proprietary technology Active programs give broad coverage of tumors No other company has routinely delivered INDs from in-house TCR platform 199 Clear scientific leadership in the field of T cell engineering Most compelling clinical data in the field Deep pipeline across major cancers
Adaptimmune: Leading the TCR T cell space 200 Clear scientific leadership in the field of T cell engineering Most compelling clinical data in the field Deep pipeline across major cancers Financial discipline and position to fund business
Adaptimmune: Leading the TCR T cell space 201 Clear scientific leadership in the field of T cell engineering Most compelling clinical data in the field Deep pipeline across major cancers Financial discipline and position to fund business Total liquidity position of $248 million* Current capital can fund the business through mid-2018 *As of December 31, 2015
Adaptimmune: Leading the TCR T cell space 202 Clear scientific leadership in the field of T cell engineering Most compelling clinical data in the field Deep pipeline across major cancers Proven ability to execute Financial discipline and position to fund business
Adaptimmune: Leading the TCR T cell space Milestones met through April 2016 Expanded into autoimmune Expanded strategic immunotherapy collaboration with GSK Secured NY-ESO breakthrough therapy designation in synovial sarcoma Secured NY-ESO orphan drug designation IND opened for AFP in hepatocellular cancer 203 Clear scientific leadership in the field of T cell engineering Most compelling clinical data in the field Deep pipeline across major cancers Proven ability to execute (1) Financial discipline and position to fund business
Adaptimmune: Leading the TCR T cell space Manufacturing processes optimized Proprietary T cell expansion method Commercial-ready process in place EU and US contract manufacturers in place 204 Clear scientific leadership in the field of T cell engineering Most compelling clinical data in the field Deep pipeline across major cancers Proven ability to execute (2) Financial discipline and position to fund business
Adaptimmune: Leading the TCR T cell space 205 Clear scientific leadership in the field of T cell engineering Most compelling clinical data in the field Deep pipeline across major cancers Proven ability to execute Financial discipline and position to fund business Goal: first TCR T cell therapy to market
Adaptimmune investor and analyst day 2016 April 22, 2016